
In the age of digital transformation, the influence of software is pervasive and undeniable. As technology continues to advance at an unprecedented pace, software is revolutionising traditional business models and redefining customer experiences. From e-commerce to finance, manufacturing to transportation, industries across the board are being reshaped by the transformative power of software.
The appetite for software is insatiable and enterprise software, cloud software, and Software-as-a-Service (SaaS) markets are each playing their part in the digitalisation of businesses. Together, they represent critical pieces in companies’ efforts to efficiently manage virtually every aspect of their businesses and often provide mission critical functions.
Before we delve deeper into how we think about those opportunities – and for perspective on how they fit together – here is a quick breakdown of each market:
Enterprise Software
Enterprise software is designed to meet the needs of organisations rather than individual users. These applications are complex and scalable, and integrate with other software and network configurations on a large scale. They serve a variety of business functions such as enterprise resource planning (ERP), customer relationship management (CRM), supply chain management (SCM), cybersecurity, observability, and data warehousing. Companies use enterprise software to manage vast amounts of data, streamline their operations, support decision-making and enhance productivity across multiple departments.
Cloud Software
Cloud software refers to applications that are hosted on remote servers and accessed over the internet, which are maintained by external vendors rather than the users themselves. In contrast to old on-premises models, cloud software allows for flexibility, scalability, and cost efficiency as it eliminates the need for organisations to purchase, run, and maintain physical servers and other on-premises infrastructure. Cloud software can be delivered through several models including Infrastructure-as-a-Service (IaaS), which provides virtualised computing resources like servers, storage, and networking; Platform-as-a-Service (PaaS), which offers a complete platform for developing, testing, and deploying applications; and Software-as-a-Service (SaaS).
Software-as-a-Service (SaaS)
SaaS is one of the most significant subsets of the cloud computing market. It is a software distribution model in which applications are hosted by third-party providers and made available to customers over the internet. Unlike traditional software that requires a license purchase and installation on individual machines, SaaS products are typically subscription or usage based and centrally hosted. This means users can access software and its functions remotely from any device with internet connectivity. SaaS offers numerous advantages, including lower upfront costs, reduced time to benefit, high scalability, and automatic updates.
Many enterprise software providers have already transitioned part or all of their offerings to the cloud, capitalising on the cloud’s scalability and operational efficiency to better serve large organisations. Similarly, the rise of SaaS over the past two decades has reshaped how businesses think about software expenditure and management, shifting from capital-intensive software ownership to more operational expense models with ongoing subscriptions.
These markets continue to grow as businesses increasingly rely on digital solutions to manage their operations, interact with customers, and compete in today’s global economy. The push toward digital transformation, accelerated by factors like remote work trends and the global scaling of businesses, further drives the demand for sophisticated enterprise software solutions, robust cloud service platforms, and accessible SaaS applications.
Cloud-based software-as-a-service models are not just good for enterprise end users; they have also ushered in an era of superior software businesses characterised by higher recurring revenues, sticky business models, stable cash flows, and lower cyclicality.
Current state of the industry
The software industry is currently experiencing a period of rapid growth and transformation. With the increasing reliance on digital technologies across various sectors, software has become a critical component of modern businesses and everyday life. The industry is driving innovation in areas such as artificial intelligence, cloud computing, blockchain, and cybersecurity.
Open-source software is thriving, fostering collaboration and community-driven development.
The industry is facing challenges such as cybersecurity threats, privacy concerns, and the need to address ethical considerations in emerging technologies. Overall, the dynamic software industry is evolving, shaping the way humans live, work, and play.
Over the past decade, the enterprise software industry has experienced rapid growth driven by increasing demand for integrated solutions across every aspect of a business’ operations.
Gartner research indicates that over the past several years, the global enterprise software market has enjoyed solid mid-double-digit percent growth (ranging between 11% and 16%), buoyed in part by initiatives to increase productivity during the COVID-19 pandemic.
According to Precedence Research, the worldwide software market grew to US$659 billion in 2023 with North America responsible for 44% of the total spend, followed by Europe (27%) and Asia Pacific (24%). It is interesting to note that the software market is expected to continue growing to US$1.789 trillion by 2032, representing a CAGR of 11.74% (Figure 1).
Figure 1: Evolution of the worldwide software market
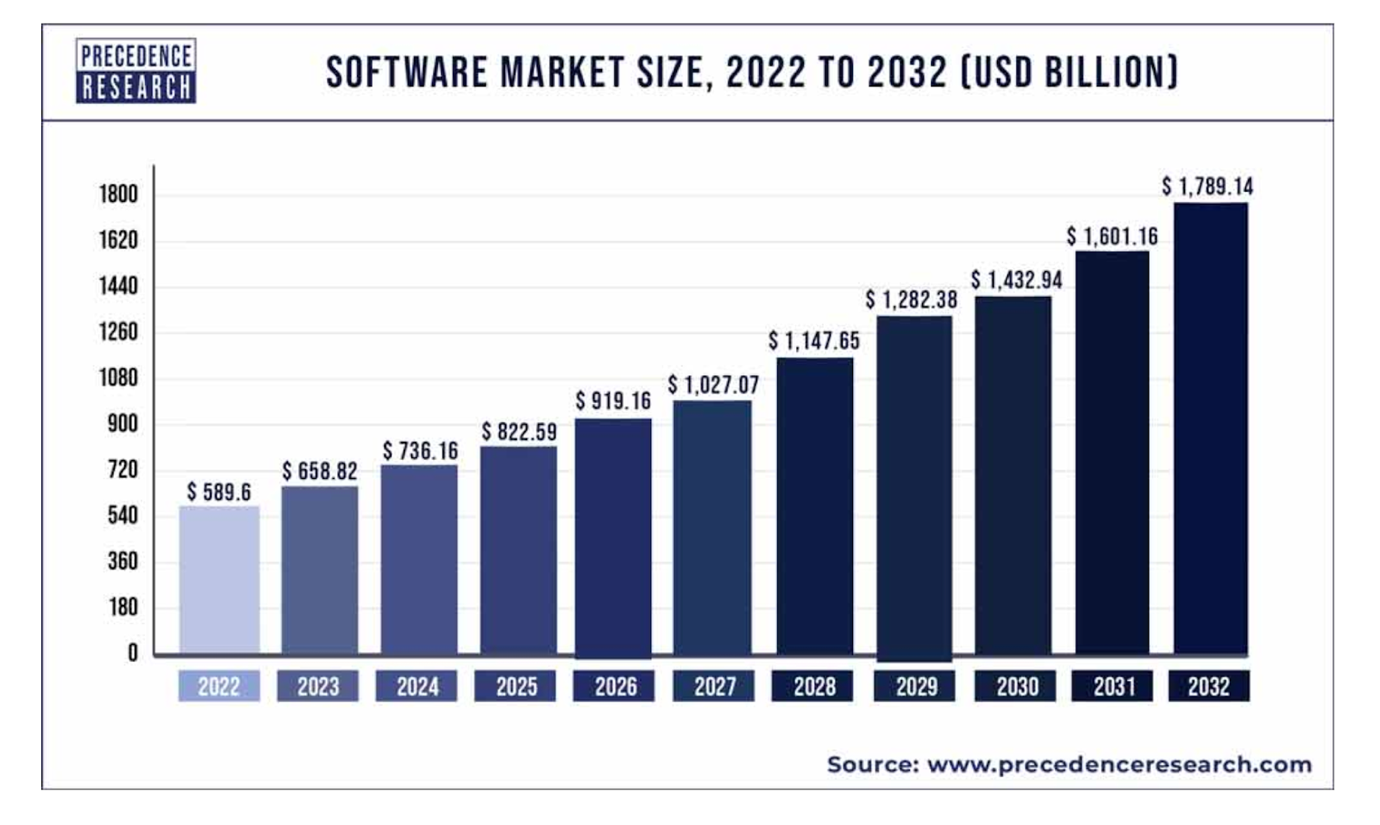
Source: Precedence Research
In 2022, on-premises software deployments still represented more than half of global enterprise software spending, highlighting the significant opportunity remaining for software companies to capitalise on the industry’s ongoing transition away from on-premises solutions and toward cloud-based offerings.
With more than half the world’s enterprise workloads still on-premises, the SaaS industry is expected to grow at a rapid clip as enterprises continue to migrate to the cloud. Today, the enterprise software and cloud/SaaS markets are dominated by several key players that have played pivotal roles in shaping its direction and technological advancements.
In 2022, the top five vendors — Microsoft, Oracle, Amazon, Salesforce and SAP — captured 34% market share, whereas the next five vendors — IBM, Adobe, Google, VMware and Cisco — held 11% market share.
In the Infrastructure-as-a-Service (IaaS) space, Amazon Web Services, Microsoft Azure, and Google Cloud dominate the industry and command decisive leadership positions (Figure 2).
Figure 2: Leaders in Infrastructure-as-a-Service
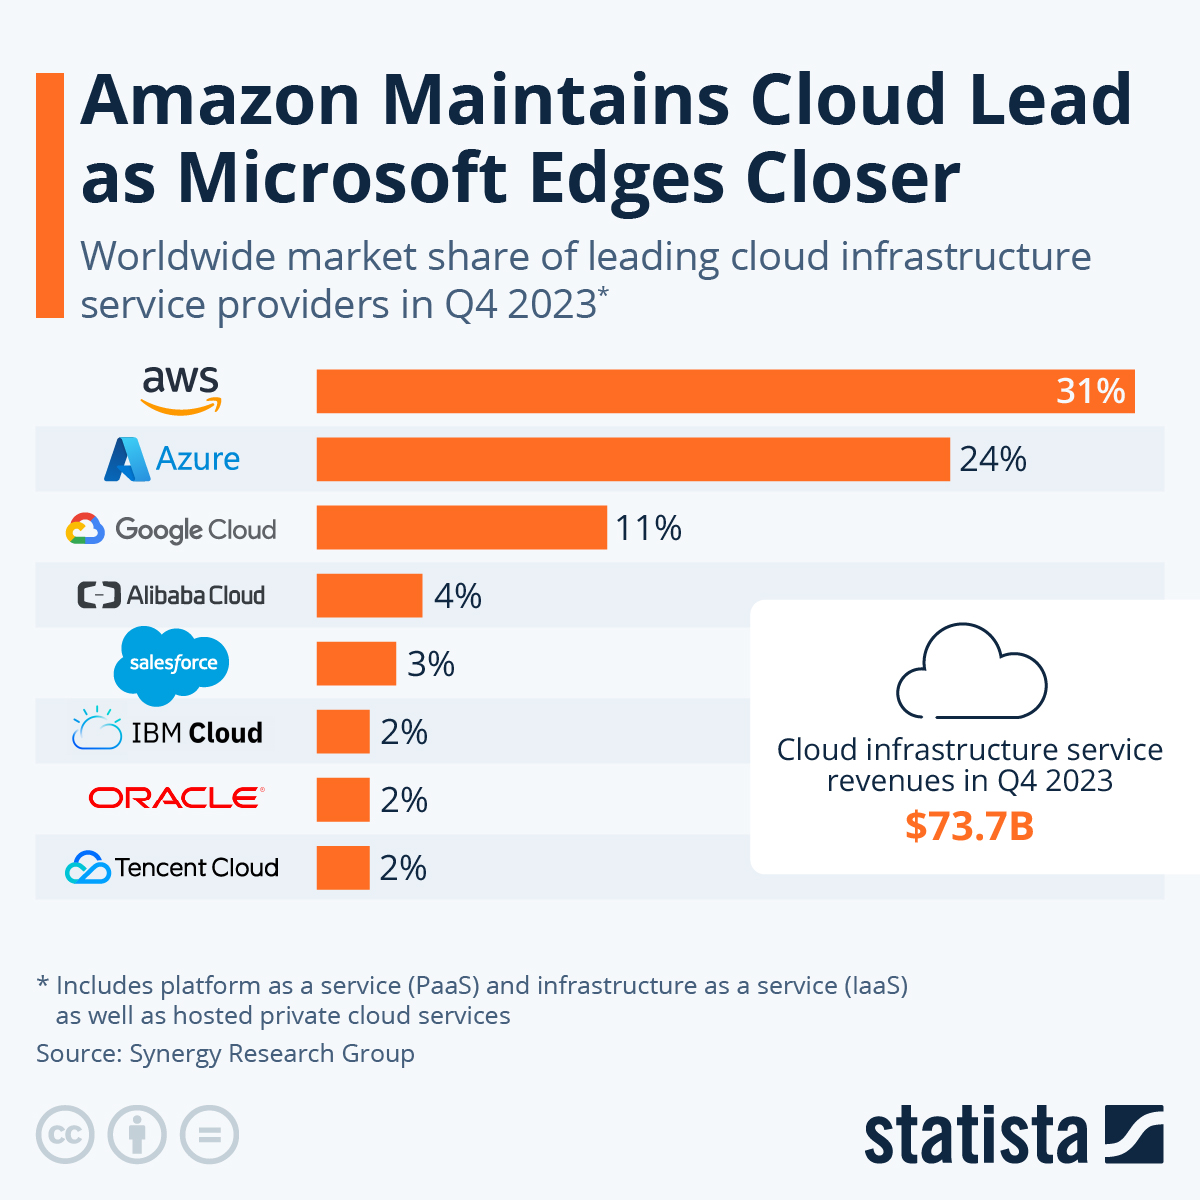
Source: Statista
Amazon Web Services (AWS) has been the clear dominant player in the IaaS industry thanks to its leadership and first-mover advantage. However, Microsoft Azure and Google Cloud are rapidly closing the gap, leveraging their existing enterprise customer relationships and integrating their cloud offerings with popular productivity and collaboration tools. The big three hyperscalers are growing quickly at scale, with AWS growing sales at high teens, with Azure and Google Cloud growing at close to 30% annually. The enormous size of the world’s cloud computing market is intensifying competition with players such as Oracle and IBM now jostling to become key players in the IaaS/PaaS market. This ongoing battle for market share could lead to more competitive pricing, better service levels, and faster innovation, ultimately benefiting customers.
Software is a good industry
The dominant businesses in enterprise software, cloud software, and Software-as-a-Service (SaaS) have business characteristics which make them attractive investments. Some of these attributes are set out below:
High growth potential: The software industry has demonstrated strong growth and the market is enormous! The SaaS market, in particular, is expanding rapidly, with projections indicating significant increases in market size over the coming years due to the shift toward cloud-based solutions and digital-transformation initiatives. Accelerated by the COVID-19 pandemic, this growth is being driven by the increased need for scalable software solutions that can adapt to changing business environments.
Recurring revenue model: SaaS and cloud services typically operate on a subscription-based model, offering predictable and recurring revenue streams and consequently, more stable cash flows and less-cyclical businesses. Unlike the traditional licence-based software business, this new model is attractive to investors because these recurring revenues provide more visibility into future earnings.
Scalability: Cloud and SaaS businesses are highly scalable as they can easily accommodate growing customer demands without the need for significant capital investments. Unlike old economy businesses which usually require significant sums of capital to grow, the marginal cost of distribution for these businesses is minimal or zero. Moreover, the subscription-based model allows for flexible pricing tiers and the ability to add or remove users seamlessly, allowing these businesses to better align their resources with customer needs.
Stickiness (high switching costs): Software businesses often exhibit stickiness due to high switching costs associated with their products or services. Once customers integrate a particular software solution into their workflows, it becomes challenging and costly to switch to an alternative. The switching costs may arise from data migration, retraining employees, or the need to rebuild processes around a new software system. This stickiness creates a competitive advantage as it fosters customer loyalty and reduces the likelihood of churn. The software vendors typically expand their offerings and upsell to their existing customers which results in high net retention rates (i.e., existing customers spending more each year). These high retention rates, combined with the recurring revenue model, lead to attractive customer lifetime values (LTV) and when combined with lower customer acquisition costs (CAC), lead to improving profitability and cash flow visibility.
Network effects: Software businesses can benefit from network effects, whereby the value of their product or service increases as more users or customers join the network. As the network expands, it creates a positive feedback loop, attracting more users and generating additional value. The larger the user base, the more valuable the software becomes, creating a barrier for potential competitors and enhancing the market position of the business.
High margins: Software businesses often enjoy high margins due to the relatively low marginal costs associated with producing and distributing software. Once the initial development costs are covered, the incremental cost of serving additional customers or delivering software updates is typically minimal or zero. This characteristic allows software companies to achieve significant economies of scale, resulting in healthy profit margins.
Innovation and Integration: Software businesses at the forefront of technological innovation, especially when it comes to integrating cutting-edge technologies like artificial intelligence (AI), machine learning (ML), and advanced business analytics. These advancements enhance the functionality and competitiveness of cloud and SaaS offerings, making them more attractive to end users. Software vendors today are sitting on rhetorical gold mines and they are increasingly building value by deploying their own AI agents on top of their respective leading software platforms.
Our team at AlphaTarget has been studying and investing in the software industry for almost two decades. At present, a significant portion of our investment portfolio is allocated to high quality, rapidly growing software businesses.
Sizing the opportunity
Though the enterprise software, cloud computing, and SaaS markets can each be quantified individually, these three closely intertwined markets collectively present an immense opportunity for vendors to drive outsized top-line growth with attractive unit economics.
According to Precedence Research, the SaaS market is likely to nearly triple from US$358 billion in 2024 to US$1.016 trillion by 2032 (Figure 3). Whilst this market-wide growth forecast is impressive, it is notable that some mission-critical software vendors are growing their revenues and free cash flows at an even faster clip.
Figure 3: SaaS market size expected to triple by 2032
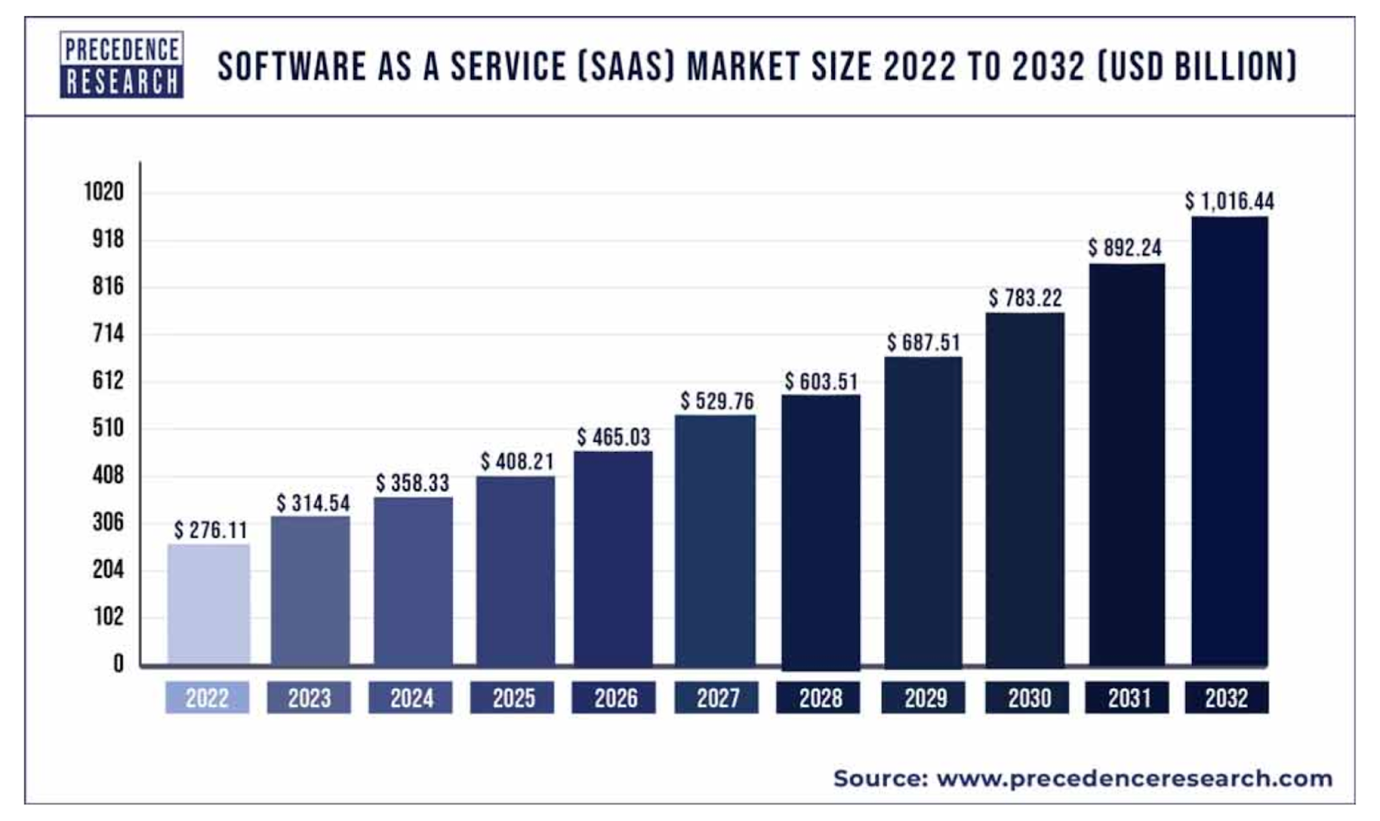
Source: Precedence Research
While the aforementioned leaders in the IaaS space are undoubtedly dominant businesses, our in-depth research at AlphaTarget has led us to invest our capital in the most promising, rapidly growing enterprise software and cloud-computing businesses with long growth runways. Our preferred businesses are run by strong management teams and we expect them to keep performing well over the foreseeable future.
At AlphaTarget, we invest our capital in some of the most promising disruptive businesses at the forefront of secular trends; and utilise stage analysis and other technical tools to continuously monitor our holdings and manage our investment portfolio. AlphaTarget produces cutting-edge research and those who subscribe to our research service gain exclusive access to information such as the holdings in our investment portfolio, our in-depth fundamental and technical analysis of each company, our portfolio management moves and details of our proprietary systematic trend following hedging strategy to reduce portfolio drawdowns. To learn more about our research service, please visit subscriptions.
The robotics industry encompasses the design, development, production, and application of robots across various sectors, with applications ranging from manufacturing and healthcare to entertainment and exploration. Robots are programmable machines capable of carrying out tasks autonomously or semi-autonomously, typically with precision and efficiency that extends beyond human capabilities.
This research piece aims to explore the current state, trends, and future potential growth of the robotics market so investors can better understand this nascent, long-term opportunity.
Though the world generally thinks of robots as primarily hardware, robotics does not necessarily require a hardware component; software robots have become more commonplace in recent years – most prominently including solutions such as automated chatbots and robotic process automation (RPA) platforms – enabled by recent rapid advancements in computing power and artificial intelligence.
The robotics industry is rapidly evolving with major technological advancements, including developments in artificial intelligence, machine learning, sensors, actuators, and materials science. These innovations are driving the creation of more intelligent, agile, and versatile robots capable of adapting to more dynamic environments and performing increasingly complex tasks both in the digital and physical worlds. As the capabilities of robots continue to evolve, their applications across industries should only expand, ushering in new opportunities and challenges for businesses, workers, investors, and society as a whole.
Current state of the industry
In manufacturing, industrial robots from companies such as Japan-based Fanuc and Sweden’s ABB already play crucial roles in automating repetitive tasks such as assembly, welding, painting, and material handling. These robots increase productivity, improve product quality, and enhance workplace safety by taking on hazardous or physically demanding tasks.
Collaborative robots, or cobots, are a newer development in the industry, designed to work alongside humans in shared workspaces, offering flexibility and adaptability in production lines.
One key example of cobots are warehouse robots in the logistics space, which have played a key part in bolstering productivity and streamlining inventory management, order fulfilment, and automated delivery in the e-commerce industry. Amazon.com was an early leader in this space, acquiring warehouse automation specialist Kiva Systems for US$775 million in 2012 and subsequently rolling out its warehouse-navigating bots across its vast network of fulfilment centres.
In healthcare, robots are revolutionising patient care and medical procedures. Surgical robots developed by Intuitive Surgical, Medtronic and Stryker have assisted surgeons in performing millions of minimally invasive surgeries with greater precision and control, leading to reduced patient trauma, faster recovery times, and improved surgical outcomes. Robots also aid in tasks such as medication dispensing, patient monitoring, and rehabilitation therapy, helping healthcare professionals deliver more efficient and personalised care.
Beyond manufacturing, healthcare, and logistics, robots are improving sectors such as agriculture, retail, and defence. In agriculture, autonomous drones and robotic harvesters are transforming crop management and harvesting processes, increasing efficiency and yields. In defence, robots from companies including Lockheed Martin, AeroVironment, Textron, and RTX are deployed for surveillance, reconnaissance, bomb disposal, and other hazardous missions, keeping human personnel out of harm’s way.
Market size, revenue share, and recent growth rates
The global robotics industry will generate revenue of more than US$40 billion in 2024, according to Statista, with the vast majority still concentrated in medical and industrial applications. The industry overall served a total addressable market (TAM) worth more than US$80 billion in 2023, having grown at a more than 10% annual clip for the past several years.
Figure 1: Robotics industry revenue share by industry
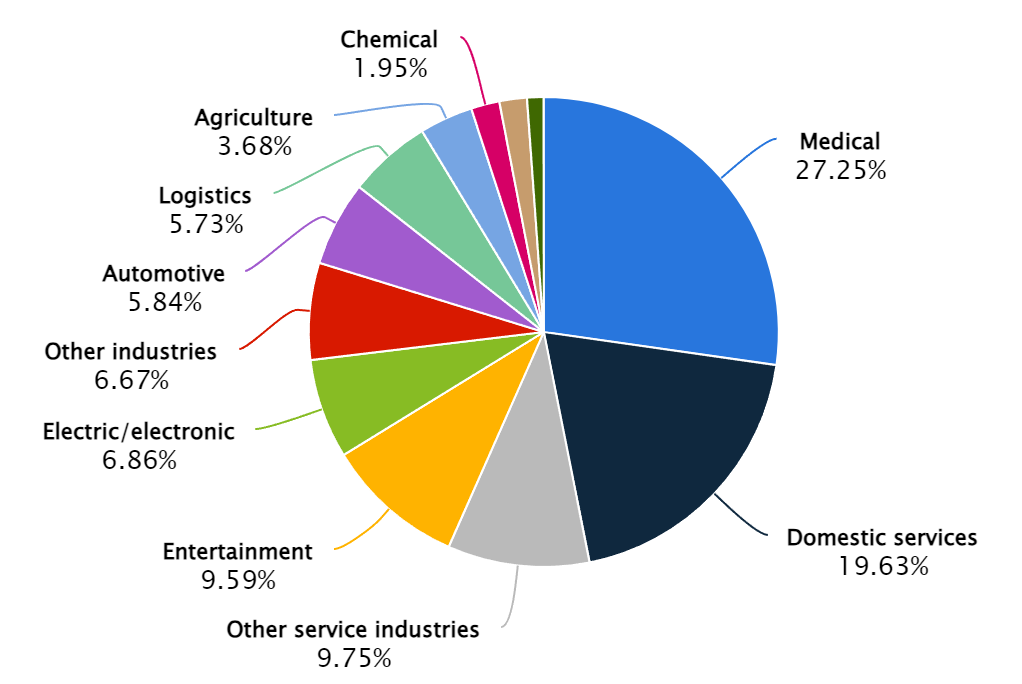
Source: Statista
Much of the industry’s recent growth, however – as well as most of its projected future growth (more on that below) – has come from professional services robots.
It was hardly surprising to that end, then, when Amazon attempted to acquire home robotics company iRobot in 2022 – a move that would have bolstered its robotics repertoire in the smart home and services segments – before the deal was ultimately scuttled by antitrust regulators in early 2024.
The case for robotics
Investing in robotics offers numerous advantages, from boosting efficiency to fostering innovation, which makes it a critical focus for future-oriented businesses and industries. Here are some of the key tailwinds that make investing in robotics a compelling option:
- 1. Increased productivity and efficiency: Robotics technology significantly enhances productivity in manufacturing and service sectors by performing tasks faster and with greater precision than human workers. Robots can operate continuously without breaks, which maximises output and efficiency and they do not become ill or require annual leave.
- 2. Cost reduction: Over time, the use of robotics can lead to substantial cost savings. Robots reduce labour costs, minimise errors, and decrease waste. Additionally, predictive maintenance capabilities of modern robots can prevent costly downtime for a wide variety of both robotic and non-robotic platforms alike, anticipating and addressing potential mechanical issues before they become problematic.
- 3. Safety and ergonomics: Robotics can tackle dangerous or hazardous tasks that pose undue risks to human workers. This not only reduces the likelihood of workplace injuries but also improves the overall working conditions.
- 4. Innovation and competitive advantages: The deployment of robotics technology drives innovation by introducing new capabilities and enabling businesses to explore new product lines and markets. Companies that adopt robotics can gain a significant competitive edge, as they are often seen as leaders in technological adoption.
- 5. Addressing labour shortages: In many industries, there is a growing gap between the availability of skilled labour and the requirements of modern production processes. Robots can fill this gap, especially in regions or sectors experiencing labour shortages, ensuring that production levels and growth targets are met.
Investing in robotics is not just about automating tasks; it’s about transforming business operations to be more efficient, safe, and innovative. This transformation is crucial as industries evolve and the global market becomes more competitive. By embracing robotics, companies can better position themselves for future growth and success. And investors can benefit from this success by putting their capital to work accordingly.
Key developments and trends
At present, the industrial sector is primarily using robots in manufacturing to enhance productivity and efficiency. The integration of incrementally advanced AI in recent years has allowed these robots to perform increasingly complex tasks such as predictive maintenance and quality control, further driving their adoption. The professional services sector, which includes logistics, healthcare, and hospitality, is also seeing increased utilisation of robots for tasks like transportation, cleaning, and personal assistance.
The robotics industry is experiencing dynamic growth and accelerating innovation, driven by advancements in artificial intelligence (AI), collaborative robots (cobots), and service robotics.
At the time of writing (May 2024), the key trends shaping the robotics sector include:
- 1. Artificial intelligence integration: AI continues to be a major driver in the robotics industry, enhancing robot capabilities in autonomy, predictive maintenance, and interaction. AI enables robots to handle complex tasks and environments by improving their decision-making and efficiency
- 2. Growth of collaborative robots (Cobots): Cobots are designed to work alongside humans in a shared workspace, enhancing safety and efficiency. They are increasingly being used across various industries, including automotive and electronics, due to their adaptability and ease of integration.
- 3. Expansion of service robotics: Service robots are being deployed across a wide range of non-industrial sectors such as healthcare, logistics, and hospitality. These robots perform tasks ranging from transportation and logistics support to personal assistance and healthcare services, reflecting a growing diversification in robot applications.
- 4. Improving dexterity and digital twins: Innovations like mobile manipulators combine mobility with manipulative abilities, enabling robots to perform material handling and maintenance tasks more efficiently. Additionally, digital twin technology is being used to optimise robot operations through virtual simulations, which predict performance outcomes and maintenance needs. Autonomous vehicle designers are actively using digital twin technology, for instance, to explore new designs and sensor combinations as well as improving reaction times.
- 5. Humanoid robots and Robot-as-a-Service (RaaS): Humanoid robots are being developed to operate in environments designed for humans, performing a range of tasks from warehouse operations to customer service. Meanwhile, RaaS models are also gaining traction, allowing companies the ability to deploy robotics without massive upfront investments in R&D and hardware, further lowering the barrier to automation adoption.
Sizing the opportunity
The robotics market is expected to grow rapidly over the next several years (Figure 2). According to research firm Boston Consulting Group, the market for robotics is expected to grow from approximately US$40 billion in 2024 to US$160-$260 billion by 2030. This represents an annual compounded growth rate of 26-37% over the next 6 years!
Figure 2: The robots are coming
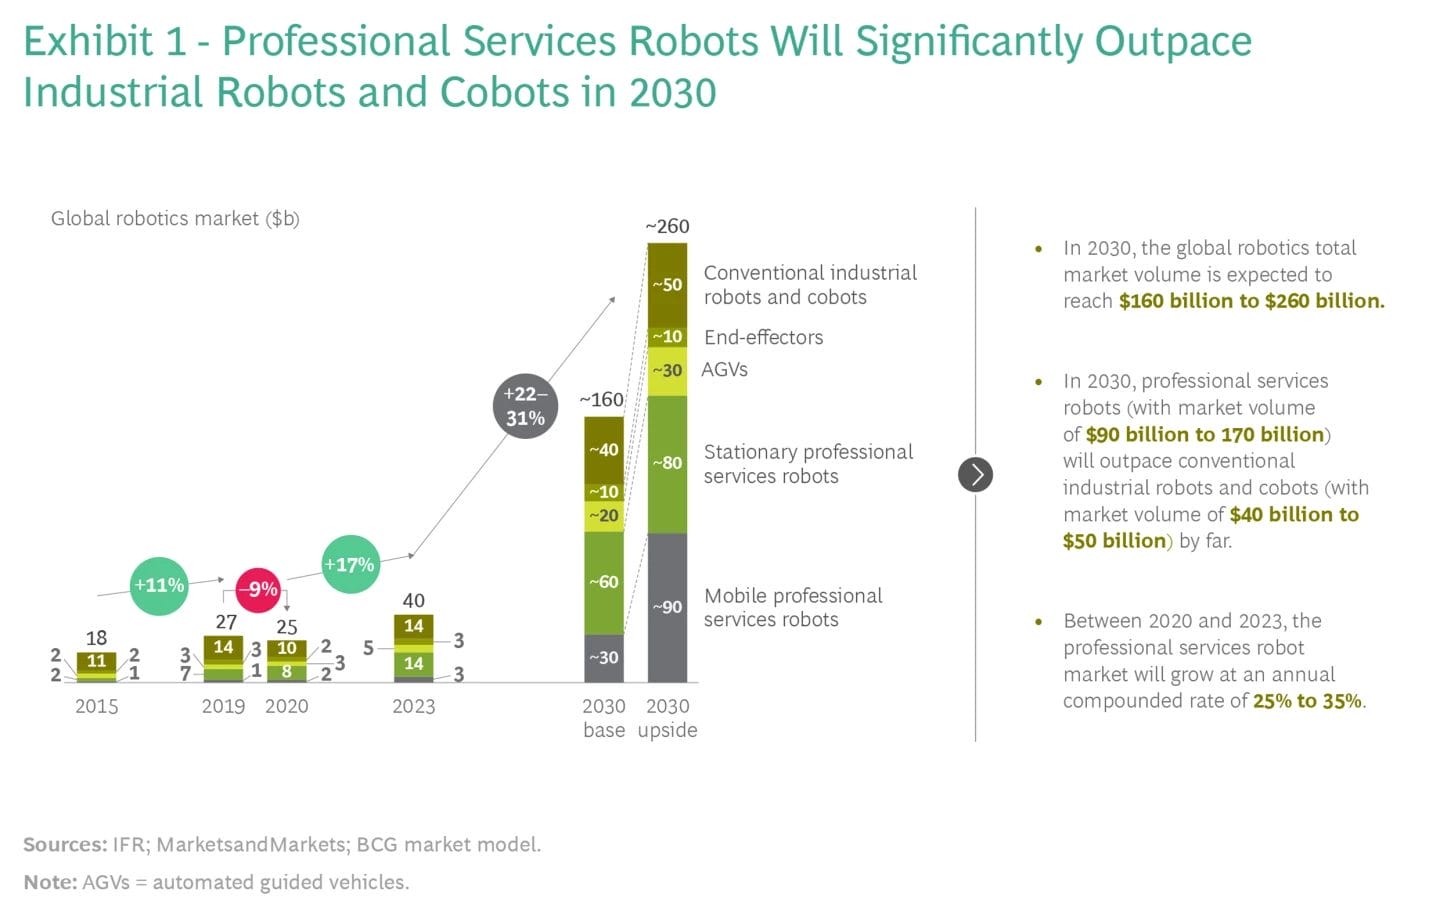
Source: Boston Consulting Group
A substantial portion of this growth is likely to come from professional services robots, which could generate twice as much revenue as conventional and logistics robots.
The collaborative robots (cobots) segment alone is projected to grow at a compound annual growth rate (CAGR) of 30.7% from 2022 to 2030 – to just under US$8 billion – indicating strong demand for robots that can safely complement the work of human partners.
Given that the total addressable market (TAM) for the robotics industry is expected to grow exponentially, it is worth considering which specific sub-sectors might represent the most promising investment opportunities.
Our research suggests that humanoid robots are arguably the most exciting growth opportunity for their combination of high-tech novelty and immense potential growth. According to research from Goldman Sachs, the global humanoid TAM could reach an estimated US$38 billion by 2035 and this projection assumes that 1.4 million units are being sold annually a decade from today. Initial humanoid robot applications will likely focus on industrial and manufacturing operations, before gradually transitioning to other industries including hospitality and personal care.
We expect Tesla and Hyundai Motor subsidiary Boston Dynamics to stand tall as leaders in humanoid robotics development in the coming years.
Various “Robots as a Service” (RAAS) offerings should also enjoy outsized growth, recurring revenues and high margins. Symbotic is one notable leader to that end, having recently teamed up with SoftBank to offer a compelling AI-based warehouse-as-a-service platform in the logistics space.
Tesla also has the potential to benefit greatly on the RAAS front through its planned robotaxi ride hailing service as well as its Optimus humanoid robot. The electric vehicle leader only recently offered consumers the first glimpse of its robotaxi app in April 2024 and Elon Musk is of the view that ultimately, Tesla’s Optimus business will become the company’s biggest business division.
Apart from Tesla and Boston Dynamics, a number of start-ups in the private markets in China, Europe and the US have also developed humanoid robots and given the size of the industry, some of these companies are likely to reward their shareholders.
At AlphaTarget, we invest our capital in some of the most promising disruptive businesses at the forefront of secular trends; and utilise stage analysis and other technical tools to continuously monitor our holdings and manage our investment portfolio. AlphaTarget produces cutting-edge research and those who subscribe to our research service gain exclusive access to information such as the holdings in our investment portfolio, our in-depth fundamental and technical analysis of each company, our portfolio management moves and details of our proprietary systematic trend following hedging strategy to reduce portfolio drawdowns. To learn more about our research service, please visit subscriptions.
The remarkable progress in healthcare and improvements in lifestyle has led to a significant increase in human life expectancy. Thanks to advancements in medical technology, improved access to healthcare and better awareness, people are now living longer than ever before.
The health and wellness secular trend has emerged as a powerful force and it has caught the attention of investors.. By and large, individuals all over the world are increasingly prioritising their physical and mental health. This shift has stirred up the business world, as companies that cater to this growing demand for “better for you” products and services are reaping substantial rewards, whereas businesses which sell harmful products are struggling.
This article aims to discuss the multifaceted dimensions of the health and wellness trend, exploring some of the underlying drivers and market dynamics.
Looking at the big picture, the consumer health and wellness industry represents an enormous and growing opportunity split into several core categories. Some of those categories are set out below:
Functional food, drink, and nutritional supplements
This category encompasses everything from vitamins and protein powders to healthier energy drinks and “functional foods” that are enhanced with specific nutrients or probiotics. These products aim to enhance overall health and performance, support exercise recovery and weight management, and prevent nutrition-related disease.
Over the years, there has been a significant increase in the availability of functional food and drink options not only in the grocery aisle (Beyond Meat, Celsius, Impossible Foods, Oatly, and Sprouts Farmers Market), but also through direct-to-consumer and restaurant channels (Cava, Chipotle Mexican Grill and Herbalife). More and more businesses are now trying to capitalise by offering “better for you” snacks and drinks; as well as plant based vitamins.
Fitness equipment and devices
This sector includes all types of physical fitness equipment, such as treadmills and stationary bikes from Peloton, as well as leading wearable devices such as Apple Watch and Fitbit that track physical activity, heart rate, sleep patterns and other useful health-related metrics. As people all over the world are pursuing more active lifestyles, businesses are developing more innovative products.
Health facilities and services
This closely related segment includes fitness memberships to gyms, wellness facilities, yoga studios and other health-related applications. Digital health apps today can provide everything from virtual fitness courses to personalised training sessions. This also encompasses digital mental health and telehealth solutions, such as those offered by still early stage leaders such as Teladoc and Hims & Hers Health.
Activewear – athletic apparel and footwear
The fitness apparel and footwear segment stands tall as a key driver of growth in the broader health and wellness industry. Growth in recent years has been driven by the popularity of so-called “athleisure” wear – that is, garments that are functional for exercise but also stylish enough for everyday wear.
Incumbent leaders in the fitness apparel and footwear spaces such as Nike and Adidas have found themselves challenged by more focused industry entrants like Lululemon, which has carved out its own niche over the past two decades in yoga apparel to take significant market share in the process. Several other companies such as Under Armour, Reebok, Hoka, Puma, New Balance are now competing in this space and meeting the growing demand for fitness apparel and footwear. Newer players have also entered this arena by leaning on technological and functional innovations, such as moisture-wicking fabrics, compression technology, and lighter, sturdier materials to enhance comfort and performance.
Beauty and personal care
The beauty and personal care segment focuses on products that enhance appearance and promote physical health – ranging from cosmetics, skin care to personal hygiene. This category intertwines with more than one core segment above, so the beauty and personal care segment has long been a staple within the broader health and wellness markets. Recent trends toward organic and natural ingredients have been integral in driving growth within this category over the last several years. Some of the major players in this segment are Avon, Estee Lauder, L‘Oreal, L’Occitane, Shiseido, Revlon and Unilever. Over the past few years, some innovative , rapidly growing companies have emerged in this space and they are trying to steal market share from the incumbents.
Current state of the industry
The global health and wellness market is currently worth nearly US$5.9 trillion and has expanded at a modest mid-single-digit percent rate for the past few years (Figure 1).
Figure 1: Evolution of the worldwide health and wellness market
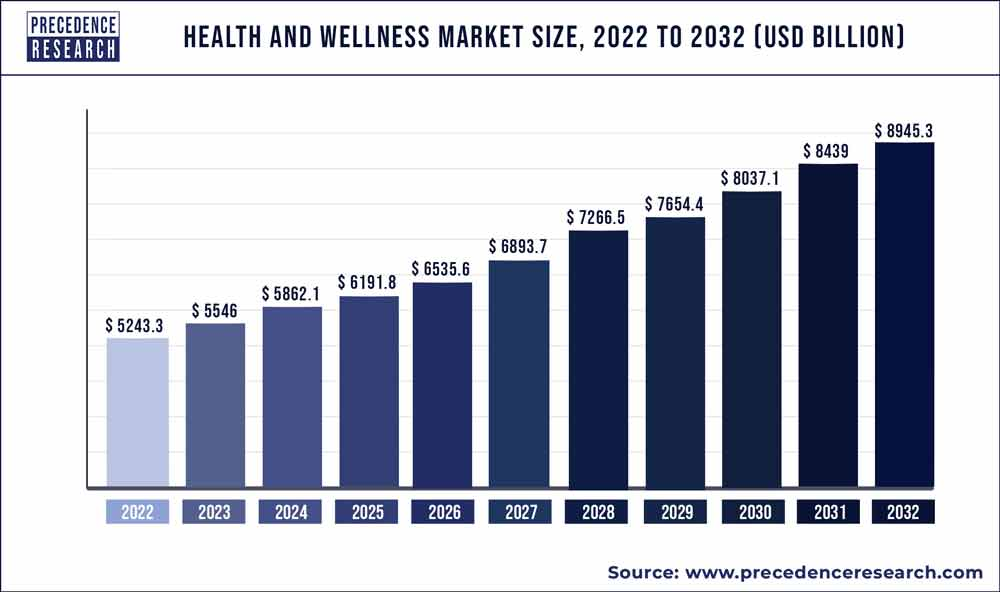
Source: Precedence Research
On a geographic basis, due to the massive population centres, rising urbanisation and industrialisation, the Asia Pacific region commands the largest slice of the health and wellness industry today, representing just over 33% of the industry’s total market share.. Interestingly, despite its significantly smaller population, North America is not far behind with a nearly 31% share, whilst Europe commands just under 26% of the market (Figure 2).
Figure 2: Health and Wellness geographic market share
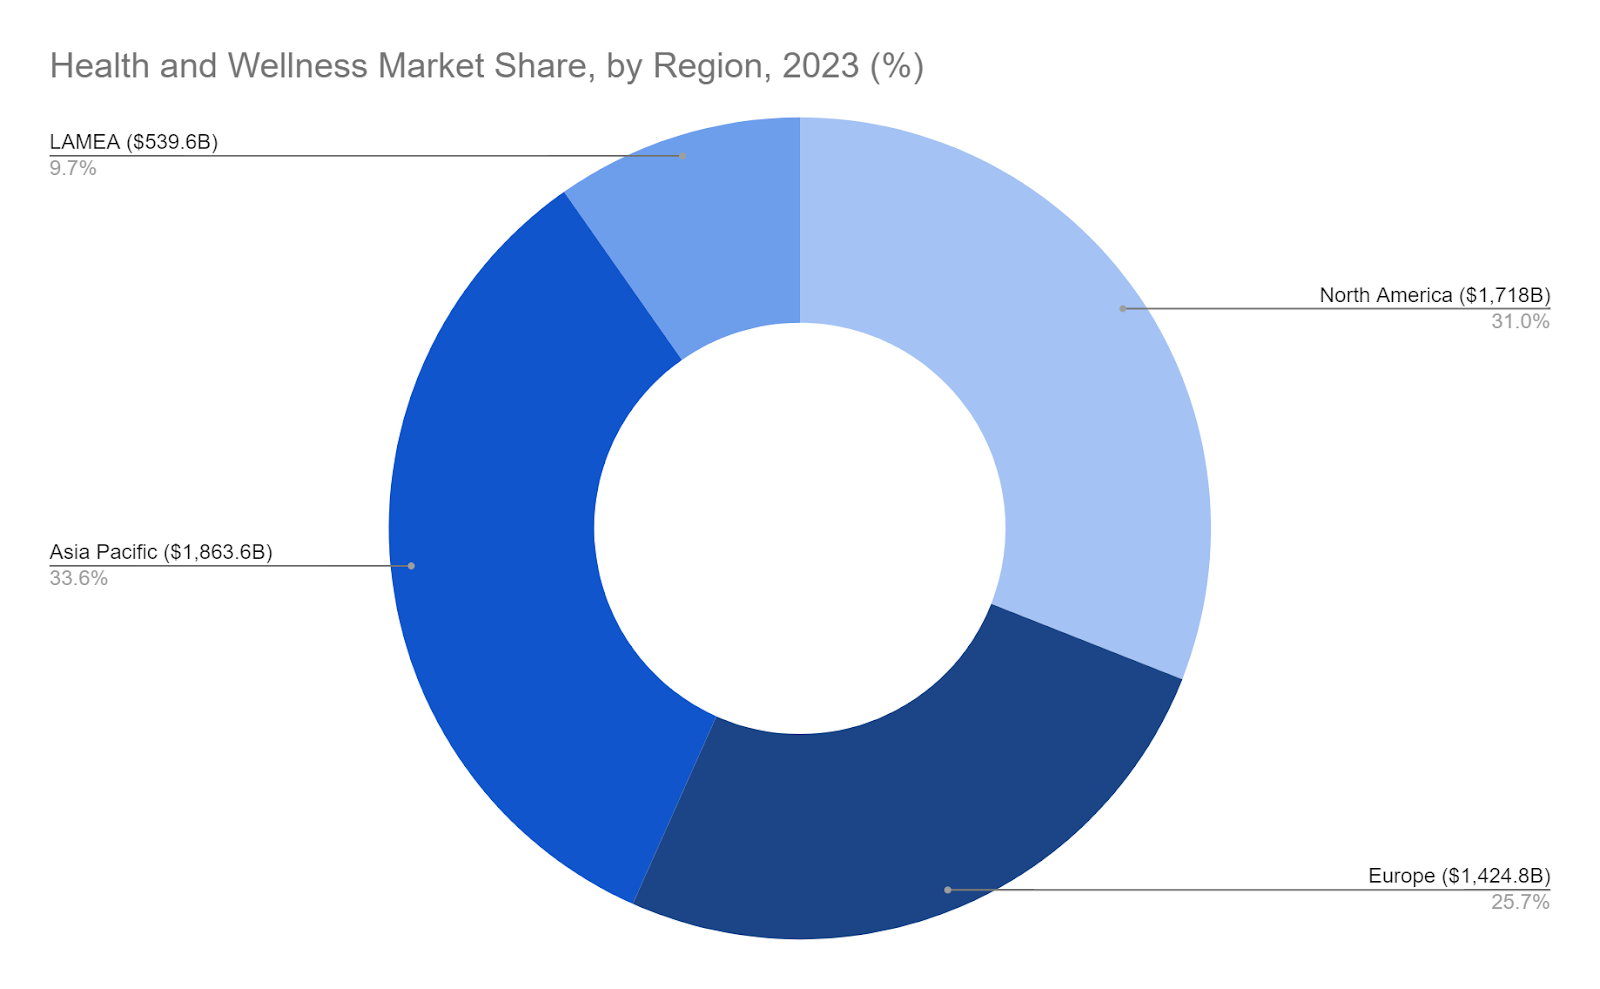
Source: Precedence Research
Growth in the industry over the past several years has largely come about from consumers’ increased focus on holistic solutions for living healthier lives, while also being fuelled by a steady increase in personal disposable incomes that have given many health-focused consumers the resources to allocate to healthier living.
The rise of social media platforms has also helped proliferate health and wellness trends, particularly among younger generations who appear most concerned about physical appearance and prospective methods to improve longevity and quality of life.
Artificial Intelligence (AI) and Machine Learning (ML) are playing pivotal roles in personalising consumer health and fitness experiences.. These technologies are being used to tailor diet plans, fitness routines, and even wellness products to individual preferences and biological characteristics.
On the dietary front, there is a clear movement among consumers toward natural produce and healthier ingredients. Consumers are increasingly wary of processed foods and are turning toward organic and locally-sourced products. This trend appears to be fuelled by the public’s improved understanding of the health benefits associated with natural, minimally processed foods, as well as ageing populations and increasing preferences for more plant-based food options. We are also seeing growing demand for products with no added sugars and reduced sugar content, as awareness about the adverse health impacts of excessive sugar consumption becomes more widespread.
Consumers all over the world are demonstrating a noticeable reduction in their appetite for consuming harmful substances such as cigarettes and alcohol. Public health campaigns and increased awareness of the risks associated with smoking and excessive alcohol consumption have contributed to this trend. The market has responded with healthier alternatives, such as e-cigarettes (the actual relative benefit of which remains to be seen), and non-alcoholic beverages, which attempt to offer similar experiences without the same elevated health risks.
The non-alcoholic beverage industry continues to adapt as well. In particular, the leadership of traditional energy drinks, often criticised for their high sugar and caffeine content, is being usurped by healthier options infused with natural ingredients, reduced sugar, and additives that promote energy naturally. Furthermore, consumers all over the world are moving away from sugar-rich sodas and gravitating towards healthier alternatives such as juices and zero-sugar carbonated beverages.
Within the broader dining sector, the fast casual restaurant industry appears to be experiencing the most notable shift towards offering more wholesome food options. Restaurants like Cava, Panera Bread Company and Chipotle Mexican Grill are incorporating more health-forward menus to appeal to health-conscious consumers, featuring items like quinoa bowls, salads rich in superfoods, and lean protein options. This shift is not just about offering “lighter” options but also about integrating flavourful, nutrient-rich foods that cater to both taste and health.
On the whole, these trends reflect a broader cultural shift toward health and wellness, where consumers are making more informed choices about their health, seeking quality and transparency in their food sources, and incorporating fitness into their daily routines as an essential part of their lifestyle. This holistic approach to health is reshaping the industry and forcing businesses to adapt to the evolving demands of today’s health-conscious consumers.
Health & Wellness is an attractive industry
The health and wellness industry is home to strong consumer brands and companies in this space benefit from the following favourable business characteristics:
Brand loyalty: Consumer products are associated with strong brand loyalty. Most people are creatures of habit and when they get used to a product, they develop a strong affinity and loyalty towards the brand which creates repeat business.
Stable cash flows: Brand loyalty creates a stable customer base and frequent, repeat purchases or subscriptions/memberships generate consistent revenues and cash flows.
Pricing power: Strong consumer brands have pricing power and these businesses are able to charge a premium price, which boosts their profits and return on invested capital (ROIC).
Consistent demand: One of the key characteristics of businesses in the health and wellness category is their consistent demand (reduced cyclicality). Unlike some industries that are more vulnerable to economic downturns (energy, industrials, logistics, mining, real-estate and shipping), the majority of businesses in the health and wellness category benefit from relatively stable consumer demand. Whilst no industry is entirely protected from economic downturns, the health and wellness tends to demonstrate more resiliency and stability. This reduced cyclicality results in stable cash flows which makes these businesses more resilient.
Large, expanding market: The global health and fitness market is large and expanding at a relatively fast clip. This growth is not just in traditional areas like gym memberships, supplements, and healthier food and drink, but also in emerging fields such as digital health solutions, wearable technology, and personalised nutrition. The world’s middle-class is expanding rapidly and as hundreds of millions of people get lifted out of poverty, they are eating and living better; and this is translating into more revenues and profits for this industry.
Sizing the opportunity
The size of the global health and wellness market is expected to grow at a modest 5.5% compound annual rate over the next eight years, to more than US$8.94 trillion (see Figure 1 above). There are pockets of growth within the industry however, and certain segments are expected to grow at a much faster pace.
According to Data Bridge Market Research, the narrower wellness food and drink market is projected to reach approximately US$1.82 trillion by 2031, representing a stronger CAGR of 9.5% (Figure 3). There exist several up-and-coming health-centric beverage companies driving outsized growth within this niche and these opportunities are attracting growth-oriented investors.
Figure 3: Global health and wellness food / drink market
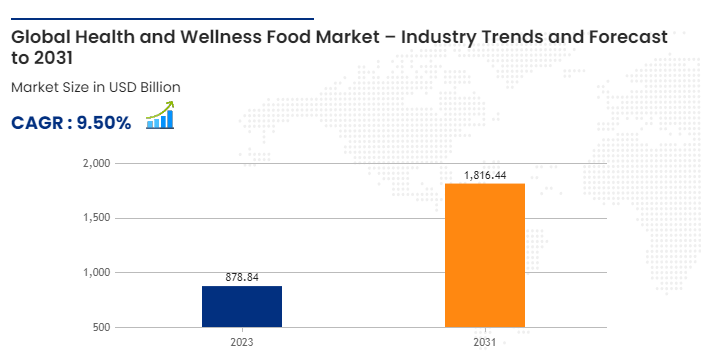
Source: Data Bridge Management
Even though segment-level growth is fairly modest within the industry, a few innovative companies are disrupting their markets and growing at a rapid pace. For instance, a few companies in the beverage, cosmetics and sports apparel/footwear space are growing their business rapidly and by doing so, they are handsomely rewarding their shareholders.
After conducting extensive research, we have invested our capital in one particular rapidly growing footwear business which is steadily improving its cash flows and profit margins.
In summary, health and wellness is more than a passing fad and the industry is home to some promising, disruptive businesses with long-term growth potential.
At AlphaTarget, we invest our capital in some of the most promising disruptive businesses at the forefront of secular trends; and utilise stage analysis and other technical tools to continuously monitor our holdings and manage our investment portfolio. AlphaTarget produces cutting-edge research and those who subscribe to our research service gain exclusive access to information such as the holdings in our investment portfolio, our in-depth fundamental and technical analysis of each company, our portfolio management moves and details of our proprietary systematic trend following hedging strategy to reduce portfolio drawdowns. To learn more about our research service, please visit subscriptions.
The financial technology (fintech) and digital payments industries encompass a broad range of financial services that leverage technology to enhance or automate financial processes and services.
Fintech refers specifically to the integration of technology into offerings by financial services companies to improve their use and delivery to customers. Early stage fintech companies are typically founded with the intent of disrupting incumbent financial institutions and corporations that rely less on software and technology as cornerstones of their respective businesses.
Some of the primary products and services offered by fintech businesses include:
- Digital payment solutions: Facilitating the exchange of money between parties through various digital methods, rather than cash or cheques.
- Personal finance and wealth management: Providing digital banking solutions, financial management and financial planning services directly to consumers.
- Lending services: Including peer-to-peer or marketplace lending platforms, which connect borrowers directly to lenders through digital platforms.
- Insurance technology (Insurtech) platforms: Using technology to simplify and streamline the insurance industry, handling everything from underwriting to claims processing and fraud detection.
- Cryptocurrencies and Blockchain products: Implementing new financial technologies for creating, managing, and transacting cryptocurrencies, and using blockchain technology for secure transactions and record-keeping.
The fintech and digital payments industries are crucial in our modern digital economy, driving innovation in financial transactions and offering consumers and businesses more flexible, efficient, and secure options for managing their financial operations. These industries are nascent and continually evolving, propelled by technological advancements and growing digital connectivity.
Current state of the industry
The fintech industry has continued to experience remarkable growth and transformation in recent years, solidifying its position as a crucial player in the global financial landscape. As of now, the industry is thriving, driven by a combination of technological advancements, evolving consumer preferences, and regulatory changes.
Fintech companies are revolutionising traditional financial services by leveraging artificial intelligence, machine learning, blockchain, and cloud computing to deliver innovative and user-friendly solutions. The adoption of mobile banking, digital payments, and online lending has accelerated, with consumers embracing the convenience, speed, and accessibility offered by these digital platforms. Moreover, fintech has extended its reach beyond retail banking, and expanded into areas such as insurance, wealth management, and capital markets.
In 2023, the banking industry generated more than US$7 trillion in revenues with year-over-year growth in volume and revenue margins. Fintech accounted for just 5 percent of the global banking sector’s net revenue! This shows that the penetration rate is still very low and the industry should continue to grow for several years. McKinsey & Company estimates that the fintech industry’s revenue is likely to double to more than $400 billion by 2028, representing a 15 percent compound annual growth rate vs. the overall banking industry’s compound growth rate of roughly 6 percent.
The digital payments market has also experienced significant growth and transformation over the past 20-plus years, led by a combination of technological innovation, increasing global digitalisation and changing consumer preferences.
According to Statista (Figure 1), the transaction value of digital payments completed annually has more than tripled since 2017 and it is expected to reach US$11.53 trillion in 2024.
Figure 1: Steady growth in digital payments

Source: Statista
E-commerce transactions have historically represented an outsized share of the world’s total digital transaction value, and will likely continue to do so for the foreseeable future. As we noted in our recent e-commerce industry report, e-commerce currently accounts for a surprisingly low 20% of total retail sales worldwide and this figure is expected to expand to 23% of total retail sales by 2027.
The penetration rates are even lower in most of the developing nations where e-commerce represents just 7-9% of total retail sales. In our view, this is a major growth opportunity and the increasing adoption of e-commerce should serve as a meaningful tailwind for digital payments.
Fintech is a good industry
Fintech and online payments have some attractive business characteristics which is why we have invested a portion of our capital in a few promising companies in this industry. Here are some of the favourable attributes of fintech businesses –
High growth potential: The fintech and payments industry is characterised by rapid growth, driven by the increasing adoption of digital solutions across banking, investments, and everyday transactions. As more consumers and businesses embrace digital and mobile payment solutions, companies operating in this space continue to expand their market reach and service offerings, offering significant growth opportunities for investors.
Low cost structures: Digital companies’ overheads tend to be far lower than traditional banks. For example, fintech players do not need to invest in extensive networks of physical branches so they do not have to employ as many employees as the legacy financial institutions. This significantly reduces their operating expenses and capital requirements; and improves margins. Moreover, fintech businesses lean more on cutting-edge technology/software solutions to handle almost every aspect of their businesses, and this further enhances their offerings whilst cutting down on their human resources costs.
Passing on cost savings: Often, fintech companies pass along the resulting cost savings of their digital foundations to their customers and this enables them to grab market share. For instance, digital banks and online lenders typically offer more favourable interest rates on savings or loans; meanwhile “Insurtech” companies are able to underwrite policies with lower premiums and superior combined ratios. Since fintech companies have lower cost structures, they are able to invest more in technology which results in customer benefits such as top-notch fraud detection, faster claims processing and quicker loan approvals. These enhanced services attract more customers and enable these businesses to grow.
Frequent, repeat purchases: Fintech is known for its stickiness as customers stay loyal and engage in frequent repeat transactions. Payments and banking are inherently sticky industries i.e. once customers sign up, unless they are very disappointed, they tend to stay. This can be attributed to the innovative and diverse solutions offered by fintech companies, which address specific pain points in the financial industry. The comprehensive service offerings provided by fintech companies enhance customer satisfaction and encourage consolidation of financial activities. Frequent, repeat transactions reduce cyclicality and generate more stable cash flows for these businesses.
Rapid diversification of services: Fintech companies disrupt traditional financial sectors including banking, insurance, and asset management by continuously introducing new products and services. This diversification not only attracts a broader range of consumers and makes the company’s offerings more “sticky”, this spreading of revenue streams across different financial services also mitigates business risk.
Financial inclusion: Fintech companies often provide financial services to underserved or unbanked populations, particularly in emerging economies. For instance, over the past decade, mobile payment systems have enabled transactions and financial management in much of the developing world without the need for traditional bank accounts, thereby opening up the financial system to a larger subset of the population. Globally, 76% of adults have a bank account today, up from 51% a decade ago! This is not only good for society, it is also a solid opportunity, as it allows fintech businesses to tap into previously unreachable customers who are often disenfranchised with their countries’ long-established financial institutions.
As financial technology continues to evolve, the industry’s significance is expected to increase further. It is notable that key fintech players such as PayPal, Ant Group, Stripe and Square parent Block have already achieved impressive scale given their early industry leadership. Meanwhile, startups such as digital banking leader SoFi Technologies, Brazilian fintech StoneCo, and U.S.-based insurance company Lemonade have also stormed onto the scene in recent years, bringing innovative solutions to the market, which is good for consumers.
Sizing the opportunity
The fintech industry is still fairly young and it is likely to continue its steady growth over the next decade. It is interesting to note that Mordor Intelligence expects the global fintech market to nearly double in value to $608 billion over the next five years (Figure 2), representing a compound annual growth rate of over 14% between now and 2029.
Figure 2: Fintech market size to double in 5 years
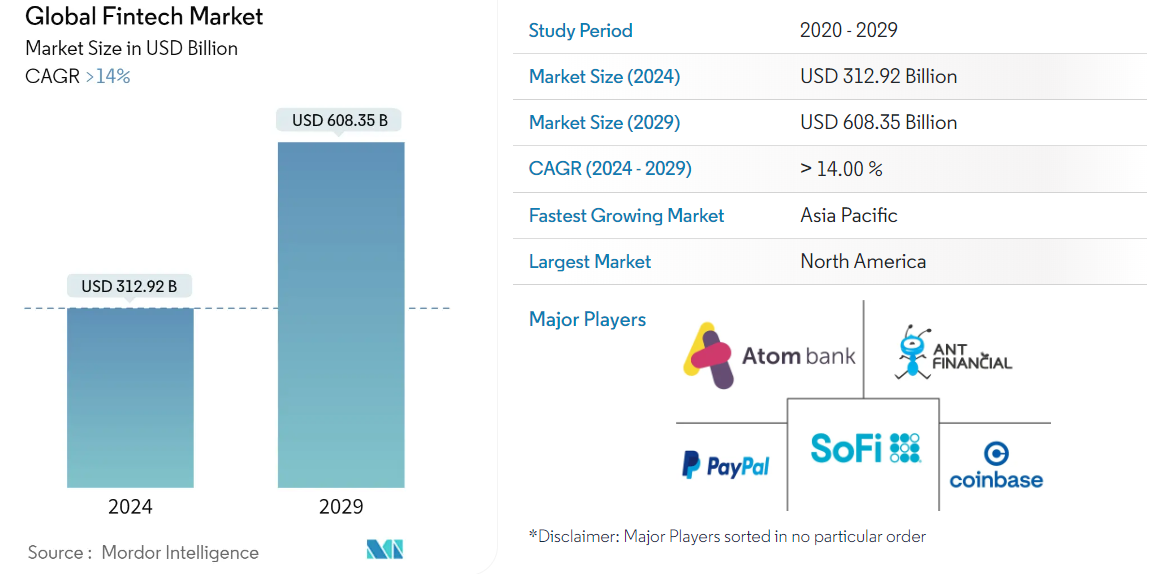
Source: Mordor Intelligence
If recent industry trends are any guide, much of the industry growth in the future will be fuelled by the developing economies. In 2023, fintech revenues in Africa, Asia–Pacific (excluding China), Latin America, and the Middle East represented 15 percent of fintech’s global revenues. It is estimated that this number will rise to 29 percent in aggregate by 2028! Conversely, last year North America accounted for 48 percent of worldwide fintech revenues and this number is expected to decrease to 41 percent by 2028.
Today, fintech penetration in the developing world is the highest in the world. This is not surprising given that up until recently, many of these nations lacked access to basic banking services which gave fintech companies the opportunity to serve unmet needs.
Due to the explosive adoption of smartphones over the past 15 years, fintech services have proliferated in the developed world. Despite this progress, the World Bank recently estimated that there are still 1.4 billion unbanked adults worldwide and most of them are in the developing world. According to the World Bank’s Global Findex report, approximately 29% of adults in the developing world still do not have a bank account and this is a major business opportunity for fintech companies in Africa, Asia and South America.
The fintech industry’s explosive growth over the past 5 years has created significant wealth for investors. According to McKinsey & Company, as of July 2023, publicly traded fintech companies represented a market capitalisation of US$550 billion, a two-times increase versus 2019. In addition, as of the same period, there were more than 272 fintech unicorns, with a combined valuation of US$936 billion, a sevenfold increase from 39 firms valued in excess of US$1 billion just 5 years ago!
In our view, the high quality, dominant fintech businesses with good unit economics will continue to prosper over the following years and that will be rewarding for their shareholders.
Just like any industry though, not all businesses are created equal and there will be winners and losers. Therefore, investors will have to carefully evaluate potential businesses before committing their capital.
At AlphaTarget, we invest our capital in some of the most promising disruptive businesses at the forefront of secular trends; and utilise stage analysis and other technical tools to continuously monitor our holdings and manage our investment portfolio. AlphaTarget produces cutting-edge research and those who subscribe to our research service gain exclusive access to information such as the holdings in our investment portfolio, our in-depth fundamental and technical analysis of each company, our portfolio management moves and details of our proprietary systematic trend following hedging strategy to reduce portfolio drawdowns. To learn more about our research service, please visit subscriptions.
The e-commerce industry has revolutionised how goods and services are bought and sold, leveraging the power of the internet to create vast marketplaces. It covers a vast range of business activities, from retail and auction websites to business exchanges of goods and services between corporations. E-commerce operates through several core market segments, including business-to-consumer (B2C), business-to-business (B2B), consumer-to-consumer (C2C), and consumer-to-business (C2B).
The e-commerce industry is characterised by its dynamic and rapidly evolving nature, driven by technological advancements and continuously evolving consumer behaviours. Online retailers must navigate various challenges such as digital payment security, logistics networks, omnichannel shopping experiences, and highly competitive market conditions. They must also adapt to changes like the increasing importance of mobile commerce (m-commerce) and the integration of artificial intelligence (AI) into e-commerce workflows. These technologies enhance personalised shopping experiences, streamline supply chain operations, and optimise customer service, illustrating the industry’s quick adoption of innovative solutions to improve efficiency and customer satisfaction.
Current state of the industry
Over the past 20 years, the e-commerce industry has experienced robust growth and widespread adoption across various global markets. According to Mordor Intelligence, the broader e-commerce market is currently worth an estimated US$8.8 trillion and actual global e-commerce spending will exceed US$6 trillion for the first time this year (Figure 1). It is notable that the global e-commerce market experienced robust growth (27%YoY) during the COVID-19 pandemic, however its growth has moderated over the past 3 years.
This steady growth over the past decade reflects the sustained global preference for online shopping and the increasing integration of technology in commerce operations.
Figure 1: Steady growth in online shopping
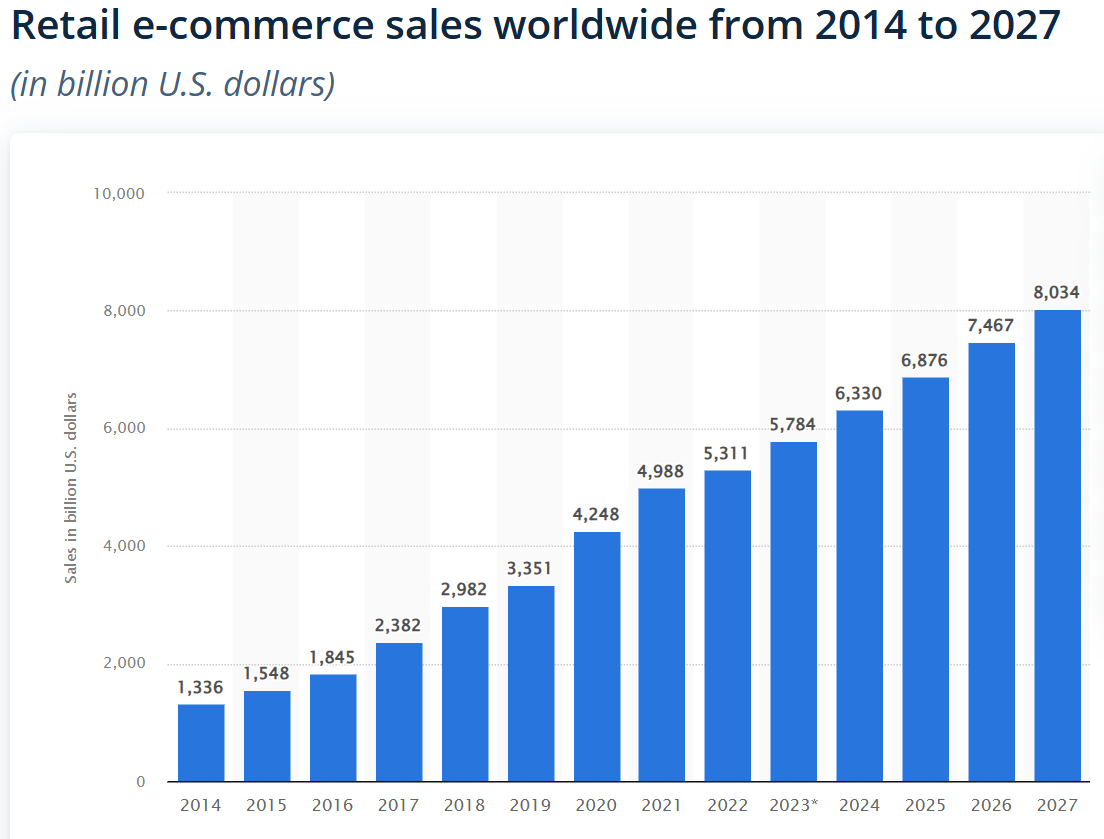
Source: Statista
The Asia Pacific region is the largest market for e-commerce and remarkably China now has a 52% global market share (Figure 2)! After all, Asia is home to approximately 60% of the world’s population and its middle-class is expanding rapidly. Moreover, the continent is experiencing rapid urbanisation and disposable incomes are also rising at a brisk pace. These factors, combined with advancements in mobile technology and more widespread smartphone adoption have made online shopping highly accessible in Asia. Interestingly, e-commerce is growing at an even faster pace in South America where the penetration rates are lower.
Figure 2: Share of the global e-commerce market
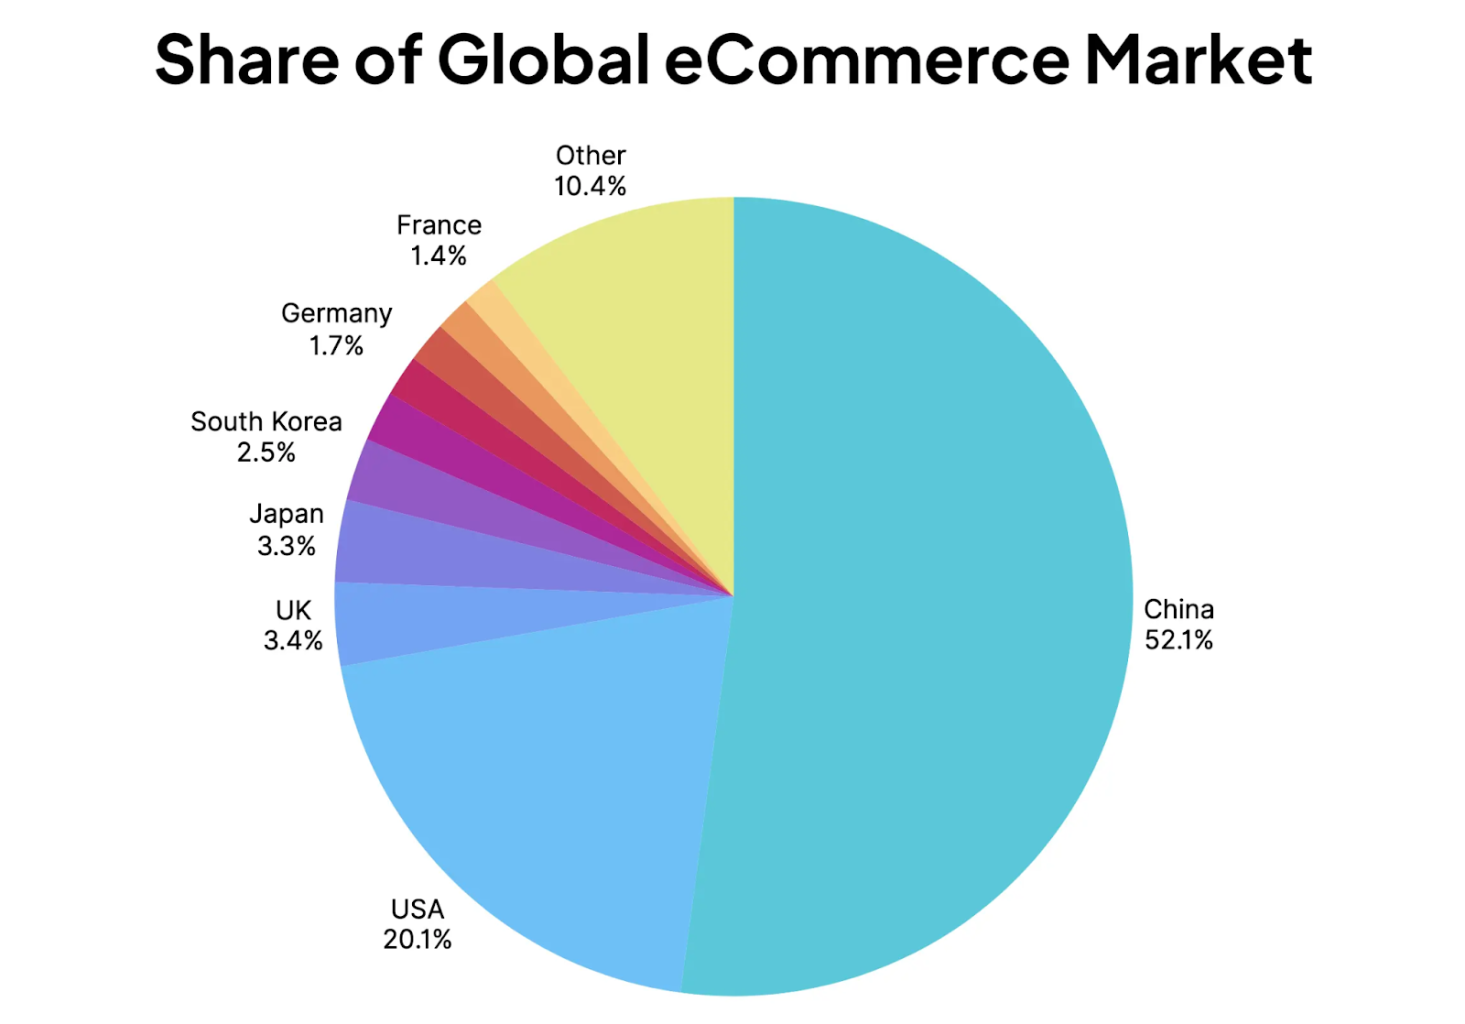
Source: Mobiloud, eCommerceDB
As you can see from Figure 2, North America and Europe also represent significant portions of the global market, with substantial growth even in maturing markets driven by technological advancements and an increasing number of consumers turning to online platforms for their shopping needs.
A better way to shop
E-commerce has been growing rapidly all over the world for several reasons. Here are some key factors contributing to its growth and popularity among consumers:
Convenience: One of the primary reasons consumers are drawn to e-commerce is the convenience it offers. Online shopping allows people to browse and purchase products or services from the comfort of their homes or virtually anywhere with an internet connection. It eliminates the need to travel to physical stores, saving time and effort.
Wide product selection: E-commerce platforms often provide a vast range of products and services in one place, offering consumers a wider selection than traditional brick-and-mortar stores. This variety allows shoppers to find items that may not be readily available locally.
Competitive pricing: E-commerce platforms often have lower overhead costs compared to physical stores, enabling them to offer competitive prices. Additionally, online retailers frequently provide discounts, deals, and promotions to attract customers. Consumers appreciate the cost savings and the ability to compare prices across different platforms.
Accessibility: E-commerce breaks down geographical barriers, allowing consumers to access products and services from anywhere in the world. This accessibility is particularly beneficial for people living in remote areas or those with limited mobility. Online shopping also provides 24/7 availability, allowing customers to make purchases at their convenience, irrespective of traditional store hours.
Personalisation and recommendation systems: E-commerce platforms employ sophisticated algorithms to analyse customer data and provide personal recommendations. By understanding consumers’ preferences and purchase history, these systems can suggest relevant products, enhancing the overall shopping experience. This personalisation creates a sense of tailored service and can lead to increased customer satisfaction.
Seamless payment and delivery: E-commerce platforms offer various secure payment methods, such as credit cards, digital wallets, or even cash on delivery. Additionally, advancements in logistics and shipping services have improved delivery times, making it more convenient for consumers to receive their purchases promptly.
Given the above factors, it is unsurprising that e-commerce penetration has grown steadily all over the world. After all, who does not like convenience, a wider selection, cheaper prices, accessibility to goods from all over the world, personalisation and a seamless delivery?
E-commerce is an attractive industry
The e-commerce industry offers several compelling advantages and in our opinion, the leading businesses in this field represent attractive investment opportunities. Here are the reasons why we have invested our capital in the dominant e-commerce platforms and the related services providers:
Two-sided network effects: The dominant e-commerce platforms (marketplaces) benefit from two-sided network effects i.e. more buyers on the platform attract more sellers, and the presence of more sellers attracts more buyers. This creates a competitive advantage and makes it difficult for new players to enter the market.
Robust growth potential: The e-commerce sector has experienced strong growth rates, significantly outpacing traditional retail sectors. As digital infrastructure continues to improve and global internet penetration increases, e-commerce is set to expand even further. This sustained growth offers investors opportunities for substantial returns.
Scalability: E-commerce businesses often have high scalability potential. With the right infrastructure and technology in place, they can handle increasing sales volumes without significant proportional increases in costs. This scalability allows for efficient growth and potential for high returns on investment.
Global reach: E-commerce transcends geographical boundaries, enabling businesses to reach customers worldwide. Unlike traditional brick-and-mortar stores limited by physical locations, e-commerce businesses can tap into a global customer base, expanding their market opportunities.
Lower costs: E-commerce businesses generally have lower overhead costs compared to physical stores. With reduced expenses related to rent, utilities, and in-store staffing, e-commerce operations can achieve higher profit margins.
Data and analytics: E-commerce businesses generate vast amounts of data, providing valuable insights into consumer behaviour, preferences and market trends. By leveraging data analytics, e-commerce companies can make data-driven decisions and optimise their strategies for better customer targeting and marketing. This data-driven approach enhances operational efficiency and creates a competitive advantage.
Diverse revenue streams: E-commerce businesses often have diverse revenue streams beyond traditional product sales. They can generate additional income through services like subscriptions, advertising, commissions, affiliate partnerships, payments and logistics. This diversification reduces reliance on a single revenue source and enhances the overall financial stability of the business.
Frequent, repeat purchases: E-commerce businesses that focus on building strong customer relationships are sticky and benefit from frequent, repeat purchases and customer loyalty. Businesses with loyal customers who buy frequently can provide stability of cash flows.
Agility: E-commerce businesses deal directly with their customers, therefore they can quickly respond to market trends, consumer demands, and changing industry dynamics. This flexibility allows e-commerce companies to pivot, introduce new products or services, and stay ahead of the competition.
Given the factors highlighted above, it is unsurprising that the dominant e-commerce businesses all over the world have prospered and handsomely rewarded their shareholders. Companies such as Amazon, Alibaba, Booking.com, eBay, Flipkart, JD.com and Yandex have become household names and many other lesser known businesses in the e-commerce industry have also flourished!
Sizing the opportunity
The total addressable market (TAM) for e-commerce is vast and continues to expand significantly as more of the world’s shopping habits shift online. According to research firm Mordor Intelligence, the value of the global e-commerce market is set to more than double over the next five years to US$18.8 trillion, representing a compound annual growth rate of 15.8%.
As you can see from Figure 3, global e-commerce currently accounts for 20% of total retail sales and the penetration rate is expected to rise to 23% by 2027.
In China, e-commerce currently accounts for 28% of total retail sales and in the US, online shopping represents only 16% of total retail sales. Interestingly, the penetration rates in the developing regions of Asia and South America currently stand in the high single digits and these markets are growing at a much faster pace compared to their more mature counterparts.
The dominant e-commerce platforms such as Amazon, Alibaba, eBay and JD.Com have now become mature, consequently their growth rates have slowed down. Interestingly, a select few e-ecommerce platforms and services providers are still growing at a blistering pace and they appear to be attractive investment opportunities.
Figure 3: E-commerce penetration rate is rising
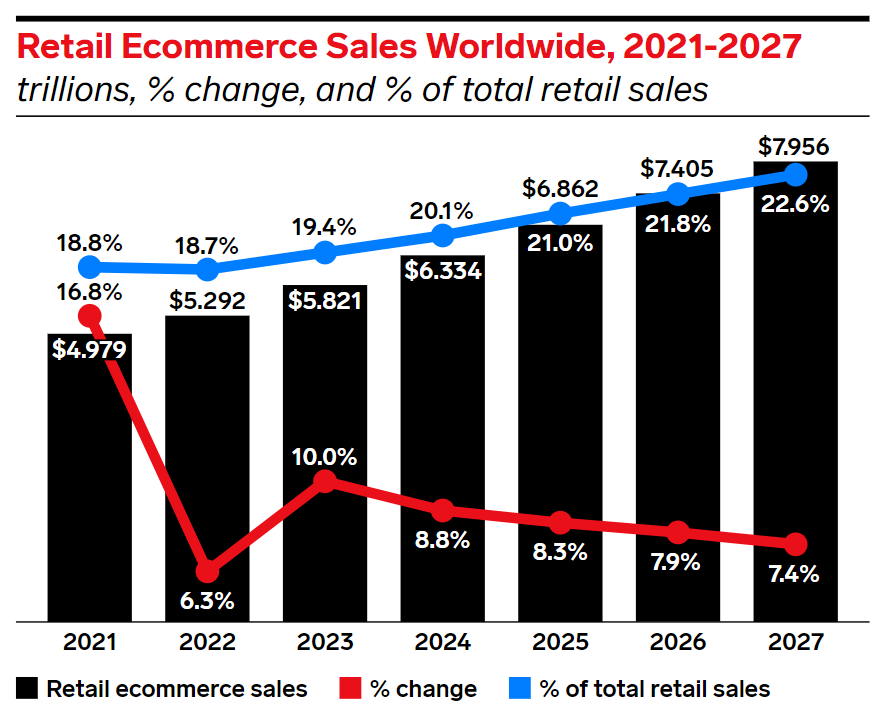
Source: eMarketer
As technology advances further and Augmented Reality and Virtual Reality become more integrated into our lives, online shopping experiences will only get better and this should benefit e-commerce businesses.
At AlphaTarget, we invest our capital in some of the most promising disruptive businesses at the forefront of secular trends; and utilise stage analysis and other technical tools to continuously monitor our holdings and manage our investment portfolio. AlphaTarget produces cutting-edge research and those who subscribe to our research service gain exclusive access to information such as the holdings in our investment portfolio, our in-depth fundamental and technical analysis of each company, our portfolio management moves and details of our proprietary systematic trend following hedging strategy to reduce portfolio drawdowns. To learn more about our research service, please visit subscriptions.
Artificial Intelligence (AI) has undeniably become all the rage in recent times and it has captivated the attention and imagination of individuals across various domains.
This research piece aims to explore the fascinating world of AI, shedding light on its true nature, its origins, societal impact and the potential for investors to capitalise on this transformative wave.
At a fundamental level, AI refers to the simulation of human intelligence in machines that are programmed to learn, reason and perform tasks with minimal human intervention. It encompasses a broad range of techniques, including machine + deep learning, natural language processing and computer vision. Thus far, AI has demonstrated remarkable capabilities in diverse industries such as finance, healthcare and transportation; and it is rapidly transforming how humans live, work and play. However, it is worth noting that as of now, AI is not a magical entity with human-like consciousness or emotions. AI is ultimately a tool developed by humans, which relies on algorithms and data to make predictions and decisions. So, let us embark on a journey to uncover the remarkable possibilities offered by AI and explore its impact on our lives.
AI – a cluster of related technologies
It is important to understand that “AI” is not any one standalone technology, but rather a group of related technologies.
The term AI is used as a catch-all for software that possesses and seeks to replicate characteristics of human intelligence. Although this might seem like a magic black box, AI systems are essentially just looking for patterns in data and drawing conclusions from them.
To better grasp AI and its investment implications, it will be helpful to first understand how the following key technologies have made AI possible and led to many of the recent breakthroughs in the field.
Machine Learning and Neural Networks
Machine learning algorithms ingest data, learn from it, and then form conclusions informed by that data. Neural networks are a type of machine learning algorithm inspired by the structure and function of neural networks in the human brain. Neural networks are capable of learning from previous experiences and examples, and can adapt their internal parameters to improve performance on specific tasks.
The key to understanding machine learning is that it allows software systems to learn and improve from data, without being explicitly programmed for every possible scenario. Instead of manually coding all the logic, developers provide machine learning algorithms with large amounts of data and let them iteratively optimise their internal models until they achieve satisfactory results on the task at hand. This enables machine learning to solve complex problems that would be extremely difficult or impossible to manually program using traditional software approaches.
For example, when social media platforms X or Facebook determine what should appear in your “feed” or timelines, they are using machine learning to make predictions about the content and posts that will be most relevant to you. Advertisers already use machine learning to optimise the bidding on millions of ad placements every second. It’s used elsewhere in tasks like monitoring customer-service calls, underwriting loans and insurance, detecting fraud, and a bevy of other applications across every industry today.
Deep Learning
Deep learning is a powerful form of neural networks. It involves training artificial neural networks with multiple layers (hence “deep”) to learn from large amounts of data and perform specific tasks, such as image recognition, natural language processing, or decision-making.
While deep learning has been studied in academic circles for decades, it gained broader attention and adoption in industry after researchers at companies like Google demonstrated its effectiveness in solving complex problems, particularly in the field of artificial intelligence.
Today, deep learning is widely used by various companies and organisations for a range of applications. For example, Google utilises deep learning in its search algorithms, language translation services, and computer vision systems. Salesforce employs deep learning in its CRM platform to analyse customer data and provide insights. IBM’s Watson system, which uses deep learning, is deployed in healthcare and retail settings for tasks like diagnosis and customer service. CrowdStrike leverages deep learning in its Falcon platform for advanced cybersecurity threat detection. Finally, companies like Tesla and Waymo heavily lean on deep learning for their self-driving vehicle technologies, enabling tasks such as object detection, path planning, and decision-making.
Natural Language Processing
Natural Language Processing (NLP) is an area of artificial intelligence that focuses on understanding, processing, and generating human language. It encompasses a wide range of algorithms and techniques designed to analyse and extract meaning from textual data, such as articles, books, social media posts, and spoken language.
Thanks to the availability of large datasets, powerful computing resources and deep learning models, NLP has made significant advancements in recent years. These advancements have enabled the creation of more accurate and robust language processing systems, leading to improved performance in applications such as chatbots, virtual assistants, language translation services, and sentiment analysis on social media.
Large Language Models (LLMs)
Large Language Models (LLMs) are powerful deep learning models trained on massive amounts of text data, enabling them to understand and generate human-like language with remarkable coherence.
LLMs such as GPT (Generative Pre-trained Transformer), PaLM, and LaMDA, are autoregressive models that generate text in a sequential manner, predicting each subsequent token based on the previously generated context. This autoregressive property allows LLMs to produce coherent and contextually appropriate language.
LLMs are capable of performing a wide range of language tasks, including text generation, question answering, summarisation, and translation. These models can be adapted to different contexts and domains via a process called “fine-tuning”, which makes these models ever so versatile for various NLP applications.
While LLMs have demonstrated impressive capabilities, there are some well-known limitations. These models can generate biased or misleading outputs (referred to as “hallucinations”), and their lack of true understanding or reasoning abilities means they should be used judiciously and with appropriate oversight.
Nonetheless, LLMs represent a significant milestone in AI research and application, given the success of tools such as OpenAI’s ChatGPT, Google’s Gemini, and X’s Grok. This is a young research area with ongoing investments in research and development, and LLMs can be expected to play an increasingly important role in various industries and applications that rely on natural language processing.
Computer Vision
Computer vision enables machines to perceive and understand visual information from images and videos. It involves techniques such as image recognition, object detection and image segmentation. Computer vision has found applications in various fields including autonomous vehicles, surveillance systems, facial recognition and augmented reality.
The above technologies have collectively played a significant role in advancing AI and enabling the development of intelligent systems that can perceive, understand, reason and interact with the world around them.
AI’s impact on society
AI’s transformative power manifests through its wide array of practical use cases across various industries.
In education, AI is revolutionising personalised learning and adaptive education systems. Nowadays, intelligent tutoring systems leverage AI algorithms to provide individualised instruction and feedback, catering to the unique learning needs of students. AI-powered content recommendation systems suggest relevant learning materials, resources, and courses, enhancing the educational experience and facilitating lifelong learning.
In the field of mobility and transportation, AI is making significant strides. Self-driving cars powered by AI algorithms are being developed and tested, promising safer and more efficient transportation systems. AI-based traffic management systems are optimising traffic flow, reducing congestion and improving overall transportation infrastructure. Furthermore, ride-hailing and ride-sharing platforms are incorporating AI algorithms to optimise driver routing and matching, thereby maximising efficiency and reducing travel times.
AI is also playing a crucial role in addressing environmental challenges. The technology is being used in climate modelling to analyse vast amounts of data and predict climate patterns, aiding in the development of effective mitigation and adaptation strategies. AI-powered energy management systems are optimising energy consumption and reducing waste in buildings, leading to increased energy efficiency and sustainability.
Moreover, AI has found applications in the creative industry, enabling new forms of artistic expression. AI algorithms can now generate music, art, and literature, blurring the boundaries between human creativity and machine-generated content. This opens up exciting possibilities for collaboration between artists and AI systems, pushing the boundaries of imagination and innovation.
AI is also positively impacting other industries. For instance, in healthcare, AI is now assisting in diagnosing diseases, drug development, analysing medical images and developing personalised treatment plans. In finance, AI is automating risk management, fraud detection and trading activities. AI-powered chatbots and virtual assistants are now enhancing customer service by providing instant support and personalised services. Industries like manufacturing are benefiting from AI-driven automation, optimisation of production processes and predictive maintenance. AI is also enhancing cybersecurity by detecting anomalies and preventing cyberattacks. In the entertainment industry, AI now fuels recommendation systems, content creation and virtual reality experiences.
As AI continues to evolve and advance, its impacts are expected to be even more profound. From personalized medicine and smart cities to cybersecurity and space exploration, the potential of AI is vast and ever-expanding.
The challenges and risks
While AI’s potential is vast, this technology is not without challenges and risks that require careful consideration.
The rapid advancement of AI is now raising concerns about the ethical implications and responsible use of this technology. There are ongoing discussions around issues such as bias in AI algorithms, privacy concerns, and the potential for AI to be used maliciously. Additionally, some deeply knowledgeable experts in this field are cautioning that AI poses an existential threat to humanity, highlighting the need for robust safeguards and responsible development to ensure the technology remains beneficial to humanity.
Another concern revolves around the potential displacement of human labour as AI technologies automate tasks previously performed by humans. While this can lead to increased efficiency and productivity, it may also result in job losses and require the workforce to adapt to new roles.
While the probability of such risks materialising is uncertain, it is crucial to address them proactively and establish frameworks that promote transparency, fairness, and the ethical use of AI.
AI – sizing the opportunity
Now that you are familiar with the key AI technologies, in order to conceptualise and frame the AI investment opportunity, it is worth revisiting the previous major technology platform shifts i.e. the adoption of the internet, the advent of the mobile era and cloud computing.
So, without further ado, let us take a trip down memory lane…
You may recall that the internet only became popular in the late 1990s/early 2000s and it enabled global connectivity, facilitated the sharing of data and knowledge, and opened up new avenues for commerce, education, and entertainment.
Only a few years later, in early 2007, former Apple CEO – Steve Jobs stepped onto a stage and unveiled the iPhone. The smartphone took the world by storm, the status quo got disrupted and the era of mobile computing was unleashed. Mobile devices enabled people to access the internet, communicate, and perform various tasks on the go, leading to significant changes in how humans interact, work, and consume information.
In the late 2000s, the cloud revolution (the widespread adoption of cloud computing) began to gain prominence and continues to evolve today. Cloud computing involves the delivery of computing services, such as storage, processing power, and software applications, over the internet. It allows organisations and individuals to access and utilise powerful computing resources without the need for extensive on-premises infrastructure.
The internet, mobile and cloud revolutions not only fostered one of the fastest technological shifts in history; they unleashed the largest wealth-building opportunity in human history! These technologies gave rise to exceptionally successful companies, which created tens of trillions of dollars in shareholder value. Firms like Amazon, Apple, Google, and Microsoft capitalised on these technologies to revolutionise industries, disrupt traditional business models, and create immense wealth for their shareholders. Numerous other companies in ecommerce, online payments, enterprise software also capitalised on these technologies and they collectively created trillions of dollars in shareholder value.
Before the internet and mobile computing, for almost a century, the list of the world’s most valuable companies was perennially dominated by businesses in banking, consumer goods, oil, and industrial conglomerates. Today, less than 25 years after the widespread adoption of the internet, mobile and cloud technologies, seven of the world’s Top 10 largest businesses (as measured by market capitalisation) are technology companies and apart from Taiwan Semiconductor Manufacturing which is currently valued around US$620 billion, the market capitalisation of each of these technology businesses in this list exceeds US$1 trillion!
If our assessment is correct, after the internet, mobile and cloud computing, AI is the next major platform shift in technology and it has the potential to impact every industry.
AI is still in its early days, but if the viral adoption of generative AI-powered large language models (LLMs) is any indication, this technological revolution has a very long growth runway.
Figure 1 shows OpenAI’s ChatGPT exceeded 100 million monthly active users within its first two months post-launch – the fastest pace of adoption of any application the world has seen to date!
Figure 1: ChatGPT’s meteoric rise!
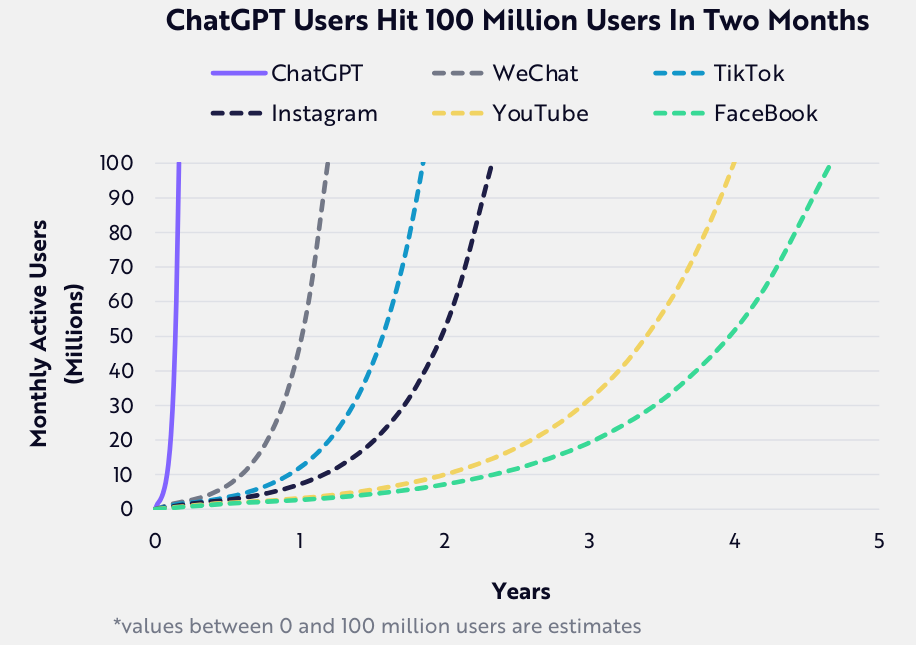
Source: ARK Invest
So far, due to the build out of data centres, the AI megatrend has primarily benefited businesses at the infrastructure layer. The biggest beneficiary has been NVIDIA which currently has more than a 95% market share of specialist AI chips. However, over the past 18 months, investors have also bid up the stocks of the mega-cap technology companies such as Alphabet, Amazon, Meta and Microsoft (which owns a sizeable stake in Open AI).
In these early years of truly useful AI, we believe the key competitive edge for companies will come from accumulating data and having the infrastructure to use AI in their own business (and even provide it to other companies). In AI, data accumulation is crucial because large datasets fuel the accuracy and performance of the AI models. The more diverse and extensive the dataset, the better equipped AI models are to understand nuanced patterns and make accurate predictions. Large datasets enable AI systems to capture a wide range of scenarios, variations and edge cases, allowing them to generalise well and handle real-world complexities. Furthermore, data accumulation facilitates the training and fine-tuning of AI models, enabling continuous improvement and adaptation to changing conditions. In essence, data accumulation is the foundation on which AI algorithms build their understanding of the world, enabling them to deliver meaningful insights, drive innovation, and unlock the full potential of AI across various industries.
Looking to the future, the next steps for AI will be transforming entire industries that have often had limited association with cutting-edge technology. As we noted earlier, self-driving cars are today’s most obvious example of how AI could transform the transportation industry, but this is just a preview of what is to come. It is highly probable that AI will soon be leveraged by nascent industries such as robotics, finance, genomics, the space economy and more.
According to a new report by Bloomberg Intelligence, the generative-AI market is poised to grow revenue by 40% CAGR to approximately US$1.3 trillion by 2032 (Figure 2)!
Figure 2: Generative AI revenue (40% CAGR until 2032)
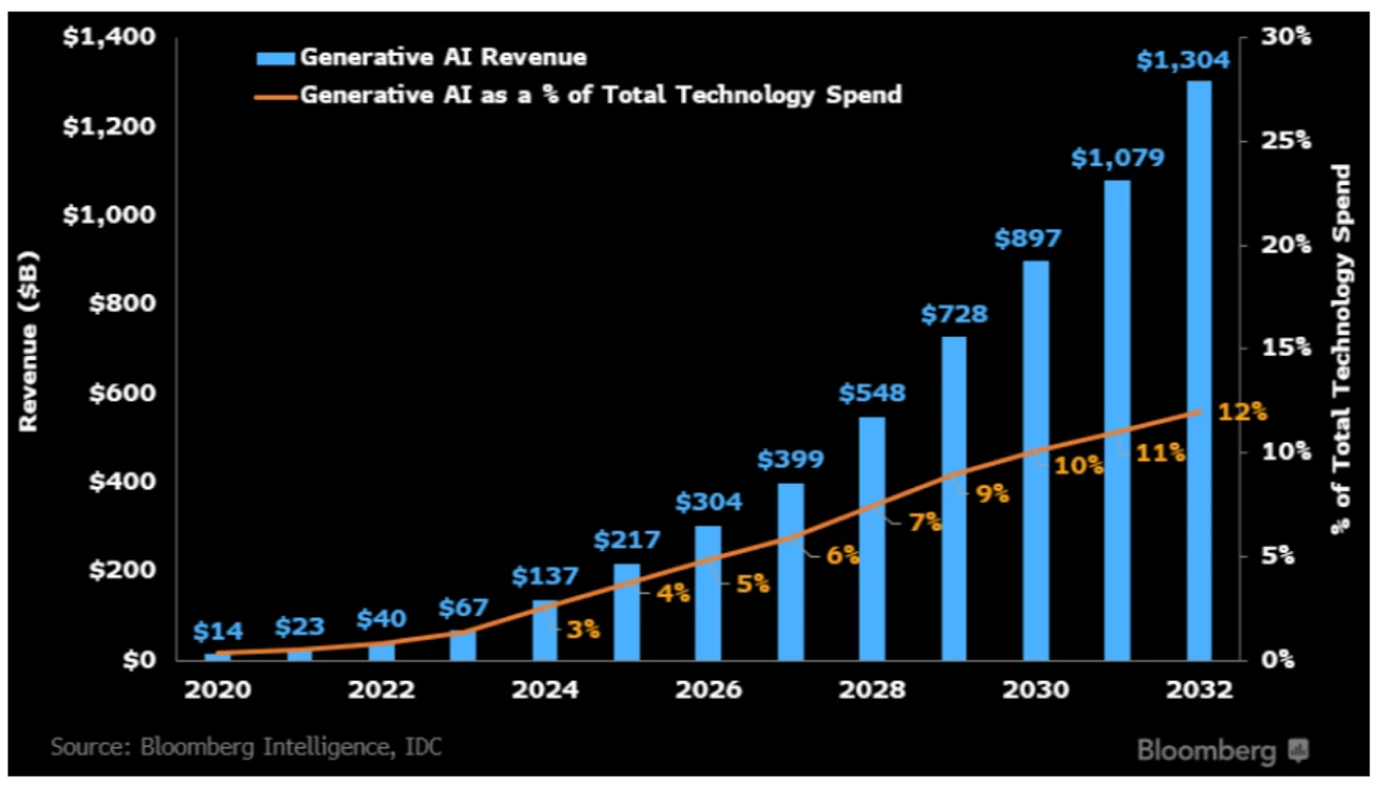
Source: Bloomberg Intelligence
Up until now, the stocks of the “picks and shovels” plays and the mega-cap technology companies have benefited from the AI boom. However, going forwards, we expect companies at the application layer as well as innovative enterprise software companies to deliver outsized gains to investors.
Recently, NVIDIA’s CEO – Jensen Huang summed it up best when he stated that “enterprise software companies are sitting on goldmines and in the future, these AI factories will have their AI agents sitting on top of their software”!
There can be no doubt that some businesses will prosper from the AI revolution but the key for investors will be to separate those businesses that are merely capitalising on hype from those that are building truly useful, scalable, investable AI applications and platforms.
At AlphaTarget, we invest our capital in some of the most promising disruptive businesses at the forefront of secular trends; and utilise stage analysis and other technical tools to continuously monitor our holdings and manage our investment portfolio. AlphaTarget produces cutting-edge research and those who subscribe to our research service gain exclusive access to information such as the holdings in our investment portfolio, our in-depth fundamental and technical analysis of each company, our portfolio management moves and details of our proprietary systematic trend following hedging strategy to reduce portfolio drawdowns. To learn more about our research service, please visit subscriptions.