
In the dynamic and ever-changing world of financial markets, investors and traders are constantly seeking strategies to gain an edge and generate consistent returns. One popular approach that has gained significant attention is trend following. Trend following is a strategy that aims to capitalise on the directional movements of various asset classes by identifying and riding trends.
Trend following is objective and instead of relying on complex analysis and forecasts, it focuses on the price reality i.e. what is actually happening in the financial markets. In the investment business, every market participant’s equity curve or profit & loss is fuelled by price action and by honing in on the price movement, trend following allows one to stay aligned with the major trends.
The reality is that money in the financial markets is made by following the trends and it is a whole lot easier to swim with the tide. Conversely, fighting the trends does not pay; in fact it is a sure-shot way of burning up a lot of emotional and financial capital.
This article explores the concept of trend following (its underlying principles), long-term performance, key components, benefits, and potential limitations.
Understanding Trend Following
Trend following is a systematic trading strategy that seeks to identify and profit from the momentum or trends in the price movements of financial assets. It operates on the belief that markets tend to exhibit persistent trends over time, and by aligning with these trends, traders can generate profits. Trend followers typically follow a set of rules and use technical analysis tools to identify and confirm trends before entering or exiting positions.
Unlike the “buy & hold” approach, which requires a market participant to remain fully invested at all times (and endure deep and lengthy drawdowns), trend following enables one to sell or hedge one’s portfolio at the start of downtrends. This means that a trend follower does not have to sit through large declines in the financial markets and suffer serious portfolio drawdowns. By either being in cash or hedged during downtrends, a trend follower is able to get out of harm’s way and/or reduce portfolio drawdowns.
As far as the stock market is concerned, “buy & hold” does well over the very long-term. However, the stock market is extremely volatile and the returns tend to be very lumpy. Put simply, the stock market does not go up every year and market participants have to contend with both secular bull-markets as well as secular bear-markets.
If you review the performance of the US stock market over the past 150 years (Figure 1), you will clearly see that the ride has been anything but smooth and there have been rewarding as well as frustrating passages of time. These rewarding long-term passages of time are called secular bull-markets and the frustrating ones are known as secular bear-markets.
Figure 1: The stock market is NOT a smooth ride
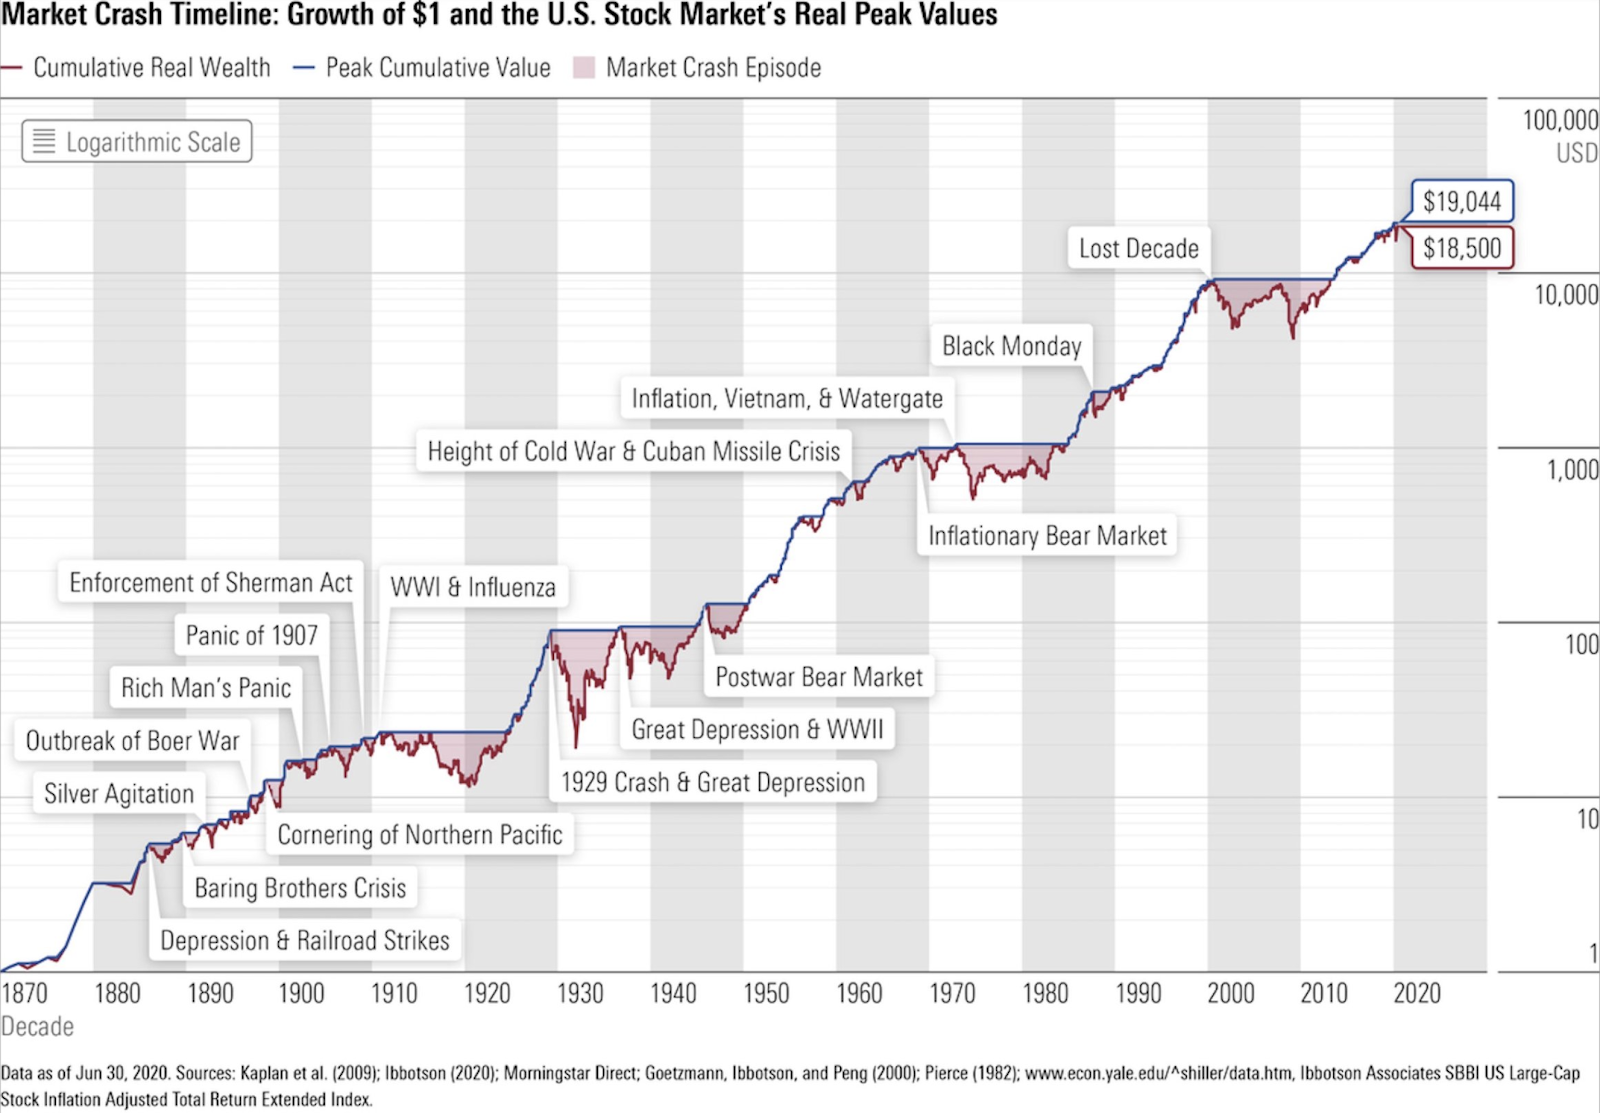
Source: Kaplan, Goetzmann, Ibbotson, Morningstar Direct, Shiller
Figure 1 shows that since 1870, on an inflation-adjusted basis, the US stock market has undergone four multi-year secular bear-markets (1910-1924, 1929-1954, 1969-1982, 2000-2013). It is worth noting that each secular bear-market not only brought about at least one 50%+ decline at the index-level, every single one lasted for a minimum of 10 years!
Unfortunately, secular bear-markets are not just a US phenomenon and they periodically occur in all the stock markets. Since 1950, there have been 25 secular bear-markets in the major world indices and each of them have lasted for a minimum of 15 years!
What about “buy & hold”?
“Buy & hold” works well over the very long-term at the index-level; however, it does not do so well for the majority of individual stocks. The reason why “buy & hold” with no risk management strategy in place works well over the very long-term at the index-level is because of the fact that stocks have an upward bias and the major stock indices are actively managed i.e. their underlying constituent companies are regularly replaced. Each year, larger and stronger companies are introduced in the major stock indices and the shrinking, weaker companies are replaced. For example, the annual churn rate of the S&P500 Index is around 4.5% and since 2015, ~40% of its constituent companies (~200 out of 500 companies!) have been replaced.
If one invests in individual stocks, then “buy & hold” with no exit strategy is not a good proposition. It is worth noting that the average company lifespan in the S&P500 Index has now shrunk to just 15 years and over the past 90 years, only 20% of the US listed companies both survived and outperformed the S&P500 Index! Furthermore, research reveals that over the past 90 years, only ~50% of US listed companies survived as standalone businesses at the 20-year mark. So, if one owns a portfolio of individual stocks, the odds are that many of the companies will underperform or not survive and this is why a risk management (exit) strategy is essential.
By utilising a trend following strategy, one can participate in the stock market’s uptrends whilst avoiding painful downtrends as well as the wrath of those destructive secular bear-markets. The main benefit of trend following is that it significantly reduces portfolio drawdowns and one ends up with a much smoother equity curve. Research indicates that for the S&P500 Index, trend following rules have reduced volatility by 33-50%, leading to higher Sharpe Ratios.
Figure 2 illustrates how trend following reduces portfolio drawdowns when compared to “buy & hold”. This is a backtest we performed on the S&P500 Index a few years ago and the lookback period was 28 years. This backtest utilised the 150-day moving average with additional rules to minimise whipsaws and as you can see, this strategy not only outperformed “buy & hold”, it also significantly reduced the drawdown to just 21.57% (vs. two 50%+ drawdowns for the S&P500 Index during the lookback period)!
Figure 2: Trend following vs S&P500 “buy & hold”
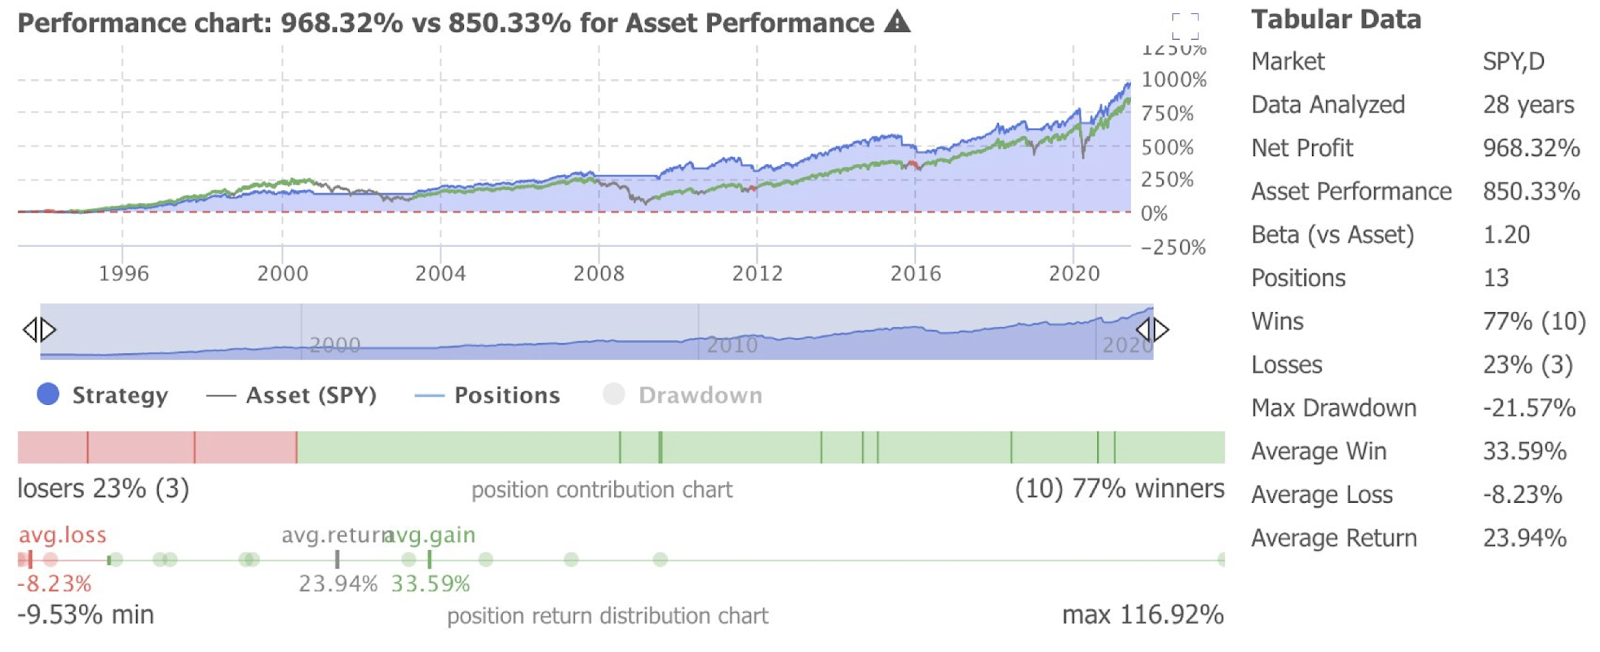
Source: Trendspider
For the sake of full transparency, we must point out that trend following strategies underperform “buy & hold” when the S&P500 Index is in a secular bull-market but they really shine and reduce portfolio drawdowns during secular bear-markets.
Finally, trend following can be utilised on all financial markets (bonds, commodities, currencies and stocks).
Key components of Trend Following
A trend following strategy utilises the following key components –
a) Trend identification: Trend followers utilise various technical indicators such as moving averages, momentum channels or volatility bands to identify the direction and strength of a trend. They aim to differentiate between bullish, bearish, or sideways market conditions.
b) Entry and exit signals: Once a trend is identified, trend followers establish specific rules for entering and exiting positions. This may involve using breakouts, moving average crossovers, or other technical signals to initiate trades. Similarly, predetermined exit rules, such as trailing stops or trend reversals, help manage risk and lock in profits.
c) Position sizing and risk management: Proper risk management is crucial in trend following. Traders determine the size of each position based on factors like volatility, account size, and risk tolerance. They often employ techniques like the use of stop-loss orders to limit potential losses and protect capital.
Benefits of Trend Following
Here are some of the benefits of the trend following approach –
a) Diversification: Trend following strategies can provide diversification benefits to an investment portfolio. They have the potential to perform well in various market environments, including bull, bear, or volatile conditions, as they do not rely on predicting market tops or bottoms.
b) Capturing large market moves: Trend following aims to capture substantial market moves by staying in positions for the duration of the trend. By riding these trends, investors and traders can potentially benefit from significant price movements and generate attractive returns.
c) Risk management: Trend following strategies often incorporate risk management techniques that help control downside risk. By setting predefined exit rules and managing position sizes, trend followers aim to limit losses and protect capital during adverse market conditions.
d) Emotional discipline: Trend following strategies are rule-based, which helps eliminate emotional biases and impulsive decision-making. Traders follow their predefined rules and signals, reducing the influence of emotions like fear or greed, which can negatively impact trading outcomes.
Potential limitations
Trend following is not a perfect approach (there is no perfect strategy or system!) and its limitations are set out below –
a) Whipsaw and false signals: Trend following strategies are not foolproof and they are susceptible to false signals, especially during choppy or range-bound markets. Rapid reversals or market noise can result in whipsaw trades, where positions are entered and exited quickly, leading to potential losses.
b) Late entries and exits: Trend following strategies may not capture the entire duration of a trend. One may enter positions after a trend has already been established and exit relatively late, potentially missing some profit potential.
c) Periods of drawdown: Like any trading strategy, trend following can experience periods of drawdown, where consecutive losing trades occur. These drawdowns can test the one’s discipline and patience, requiring a long-term perspective and confidence in the strategy.
d) Underperformance: When a stock index is in a secular bull-market, trend following strategies underperform “buy & hold”.
Summary
Trend following is a popular trading strategy that aims to profit from the directional movements of financial assets. By identifying and riding trends, trend followers seek to generate consistent returns. While there are potential drawbacks and challenges associated with trend following, its benefits, such as diversification, capturing large market moves, and disciplined risk management, make it an attractive approach for many traders and investors. As with any investment strategy, it is essential to thoroughly understand the principles, develop a robust framework, and continuously adapt to changing market dynamics. Trend following can provide a powerful tool for navigating the complexities of financial markets and potentially achieving long-term trading success.
At AlphaTarget, in order to properly time our entries and exits in our preferred growth stocks, we utilise “Stage Analysis” which is a long-term trend following strategy. We initiate new positions during Stage 1 (base building phase) and Stage 2 (rally phase) and book our gains/sell over-extended stocks during Stage 3 (distribution phase).
We also utilise a systematic trend following strategy to hedge our growth stock portfolio during stock market downtrends. If you would like to learn more about “Stage Analysis” or portfolio hedging, please read our related articles “Stage Analysis: an overview” and “Hedging: umbrella for a rainy day” on the “Resources” subpage of our website www.alphatarget.com
At AlphaTarget, we invest our capital in some of the most promising disruptive businesses at the forefront of secular trends; and utilise stage analysis and other technical tools to continuously monitor our holdings and manage our investment portfolio. AlphaTarget produces cutting-edge research and those who subscribe to our research service gain exclusive access to information such as the holdings in our investment portfolio, our in-depth fundamental and technical analysis of each company, our portfolio management moves and details of our proprietary systematic trend following hedging strategy to reduce portfolio drawdowns. To learn more about our research service, please visit subscriptions
Successful investing often requires a disciplined and systematic approach to analysing financial markets. One such approach that has gained popularity among traders and investors is “Stage Analysis”. Stage analysis was developed by Stan Weinstein, an American stock market technician and trader. In 1988, he introduced this approach in his book titled “Secrets for Profiting in Bull and Bear Markets”. In his book, Stan Weinstein outlined his methodology for identifying the primary trend and offered practical guidance for applying stage analysis in managing stock positions.
Stage analysis is based on trend following and it is a comprehensive framework that seeks to identify and capitalise on different stages of a security’s trend (Figure 1). By applying a primary trend filter (long-term moving average) and understanding the market’s stage, investors can make more informed decisions, reduce their portfolio drawdowns and potentially enhance their investment returns.
Originally, Stan Weinstein used the 30-week moving average as his primary trend filter but he has now switched to the 40-week moving average (200-day moving average). At AlphaTarget, we use the 40-week moving average as the primary trend filter for identifying any stock’s or stock market’s major trend.
Figure 1: Visual example of Stage Analysis
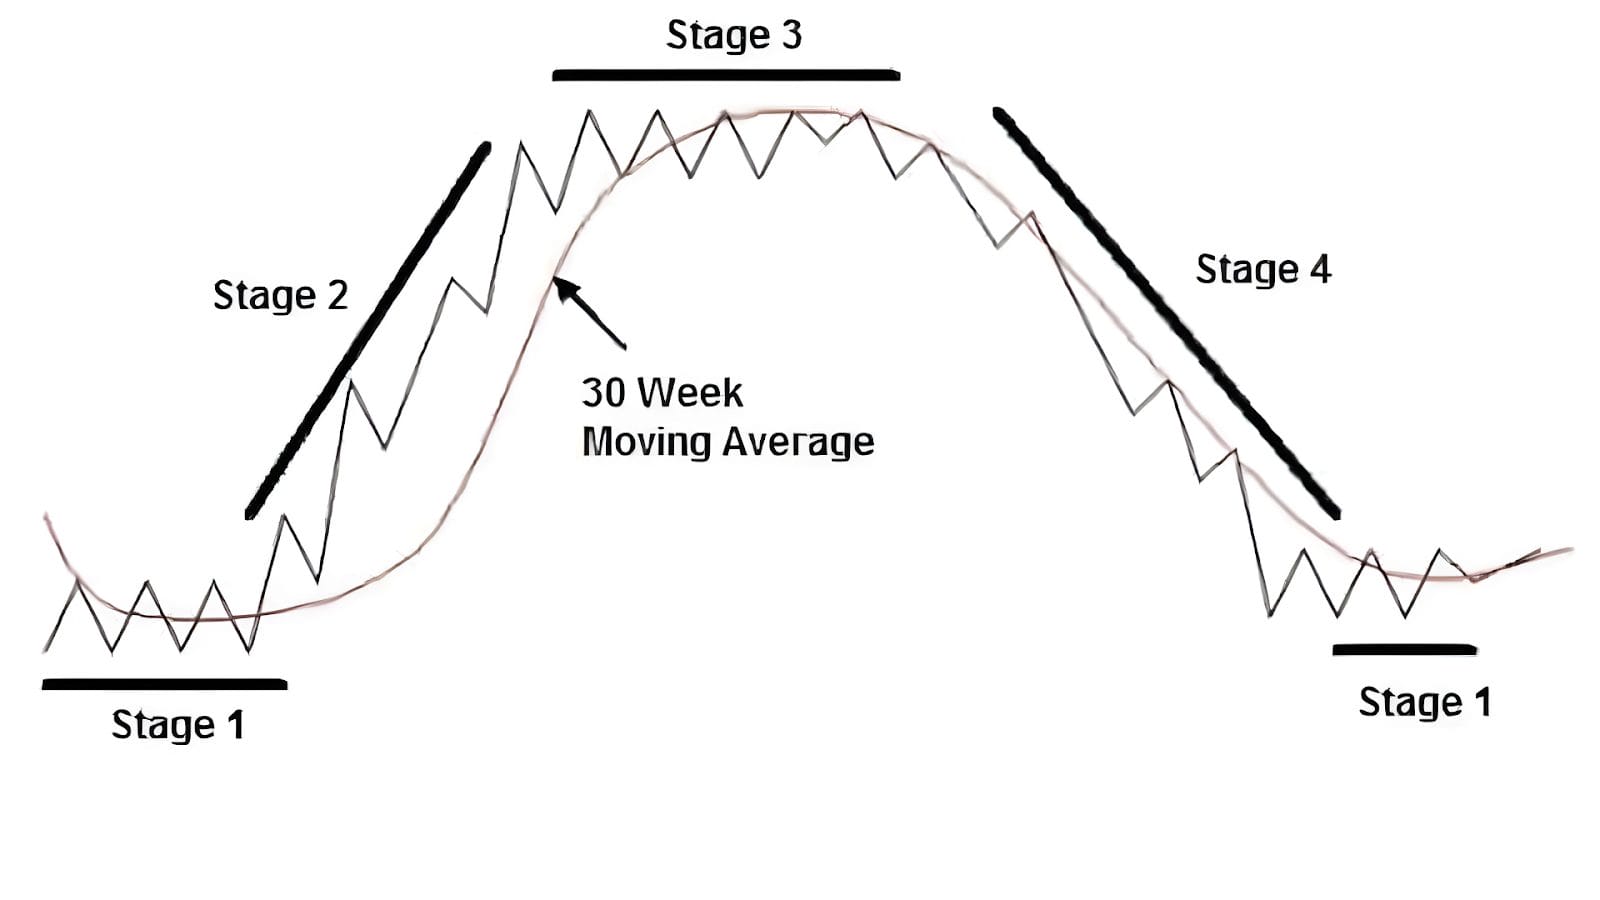
Source: Secrets of Profiting in Bull and Bear Markets, Stan Weinstein
In this article, we outline the key principles of stage analysis and how it can be applied in practice to profitably invest and trade in stocks.
Understanding Stage Analysis
Stage analysis is based on the premise that stocks and stock indices go through distinct stages of accumulation (Stage 1), markup (Stage 2), distribution (Stage 3), and markdown (Stage 4). These stages are driven by supply and demand; and more importantly by the actions of institutional investors, who have a significant influence on market trends. By identifying which stage a stock or a stock index is in, investors can align their portfolio holdings with the market and swim with the tide.
The underlying principle of stage analysis (a form of trend following) is that an investor or trader ought to buy stocks during the accumulation stage, hold stocks during the markup stage, sell stocks during the distribution stage and stay out of harm’s way during the markdown stage.
Instead of “buying and holding” stocks for the long-term, riding out the periodic downtrends and enduring large portfolio drawdowns, practitioners of stage analysis sell their holdings during the distribution phase (before the onset of large declines during the markdown stage).
A brief description of each stage is provided below:-
Accumulation Stage: The accumulation stage known as “Stage 1” is when a stock or stock index builds a trading range or “base” and this represents a period when smart money slowly accumulates positions in a security. During this stage, the 40-week moving average is flat, there is no clear trend and prices tend to be range-bound, as institutional investors quietly build their positions. Volume is usually low during this stage, and the stock or stock index exhibits a lack of clear direction. The accumulation stage can last for several weeks or even months. At AlphaTarget, we usually build positions in stocks during this stage.
Markup Stage: The markup stage known as “Stage 2” is characterised by a sustained uptrend or markup in prices. During this stage, the 40-week moving average turns up (starts sloping upwards), institutional investors actively buy the security, driving prices higher. Volume typically expands during this stage as more market participants join the trend and the price of the security tends to stay above the 40-week moving average. Breakouts from consolidation patterns and strong upward momentum are common features of the markup stage. This is the stage when the big money is made. During this stage, when the prices of securities run up too far away from their rising 40-week moving average, partial profits are booked and when prices pull back towards the 40-week moving average, cash is re-deployed.
Distribution Stage: The distribution stage known as “Stage 3” occurs when institutional investors start selling their positions. After a steady rise during the markup stage “Stage 2”, prices stop rising and they enter a consolidation phase. Volatility picks up during this stage and every rally attempt is met with renewed selling and this “tug of war” between buyers and sellers causes prices to zig and zag. Volume often remains high as institutions distribute their holdings to retail investors. During this stage, the 40-week moving average stops rising and eventually rolls over. Distribution can last for a considerable period, and it can sometimes be challenging to identify the end of this stage.
Markdown Stage: The markdown stage known as “Stage 4” represents a prolonged decline in prices; therefore, big losses build up during this stage. In this stage, institutional investors have largely exited their positions, and supply overwhelms demand. Prices exhibit a downtrend, characterized by lower lows and lower highs. Volume may initially decline during this stage, and selling pressure dominates the market sentiment. During the markdown stage, the 40-week moving average is declining (sloping downwards) and prices tend to stay below this key technical level. Towards the end of Stage 4, volume often picks up during a selling climax when novice investors throw in the towel and institutions start snapping up bargains. Practitioners of stage analysis, do not hold falling securities during this stage and they stay out of harm’s way.
Applying Stage Analysis in Practice
Stage analysis can be applied to various financial markets, including stocks, commodities, and cryptocurrencies. Here are some key steps to keep in mind when utilising stage analysis:-
Chart Analysis: Start by analysing price charts of the asset you are interested in. Look for evidence of accumulation, markup, distribution, or markdown stages. Identify key support and resistance levels, and chart patterns to assist in determining the market stage.
Volume Analysis: Examine volume patterns during different stages. Volume can provide insights into institutional activity and the strength of market trends. Higher volume during markup stages and lower volume during distribution and markdown stages can be indicative of market behaviour.
Relative strength: When applying stage analysis on stocks, gauge a security’s relative strength versus the S&P500 Index to determine if it is stronger or weaker than the broad market. Focus on securities which are showing relative strength.
Risk Management: Implement proper risk management strategies to protect capital. Set stop-loss orders and define risk-reward ratios based on the identified stage. Adjust position sizes and trailing stops as the market progresses through different stages. Never own a security during the markdown stage (Stage 4) when prices are trending lower beneath the declining long-term moving average.
Real-world example
Financial markets are driven by human emotion and when investors are optimistic and confident about the future prospects, they engage in buying activity, driving prices higher and creating an upward trend. This positive sentiment can become contagious, attracting even more buyers and further fuelling the trend.
Conversely, when fear or pessimism dominates the market sentiment, investors engage in selling activity, causing prices to decline and creating a downward trend. Negative news, economic uncertainty, or geopolitical tensions can trigger such emotions and lead to a cascade of selling pressure.
As long as emotional human beings are involved in the financial markets, assets and securities will continue to trend in both directions and this will allow trend followers and practitioners of stage analysis to exploit these exaggerated price swings.
In order to show that stage analysis still works in the real-world, we want you to review the boom and bust phenomenon of ARK Innovation ETF (Figure 2). Admittedly, this is an extreme example of a severe boom and bust cycle caused by the Federal Reserve’s extreme policies. Nonetheless, this chart beautifully demonstrates how utilisation of stage analysis would have enabled an investor or trader to capture gains and leave the party before everything turned into pumpkin and mice.
During 2020, in response to the unprecedented monetary easing by the Federal Reserve, the ARK Innovation ETF (ARKK) broke out into its markup stage (Stage 2) and its price increased by ~400% within a year! Thereafter, when inflation rose and the Federal Reserve pursued tight monetary policies, ARKK peaked in a classic distribution stage (Stage 3) and eventually, it gave back all of its prior gains during its markdown stage (Stage 4)! Note how the 40-week moving average (red shaded area on the chart) remained flat during Stage 1, rose during Stage 2, peaked/rolled over during Stage 3 and sloped downwards during Stage 4.
The black line in the bottom panel shows how ARKK exhibited relative strength versus the S&P500 Index during Stage 2 and relative weakness during Stage 3 and 4.
Figure 2: Real-world example of stage analysis
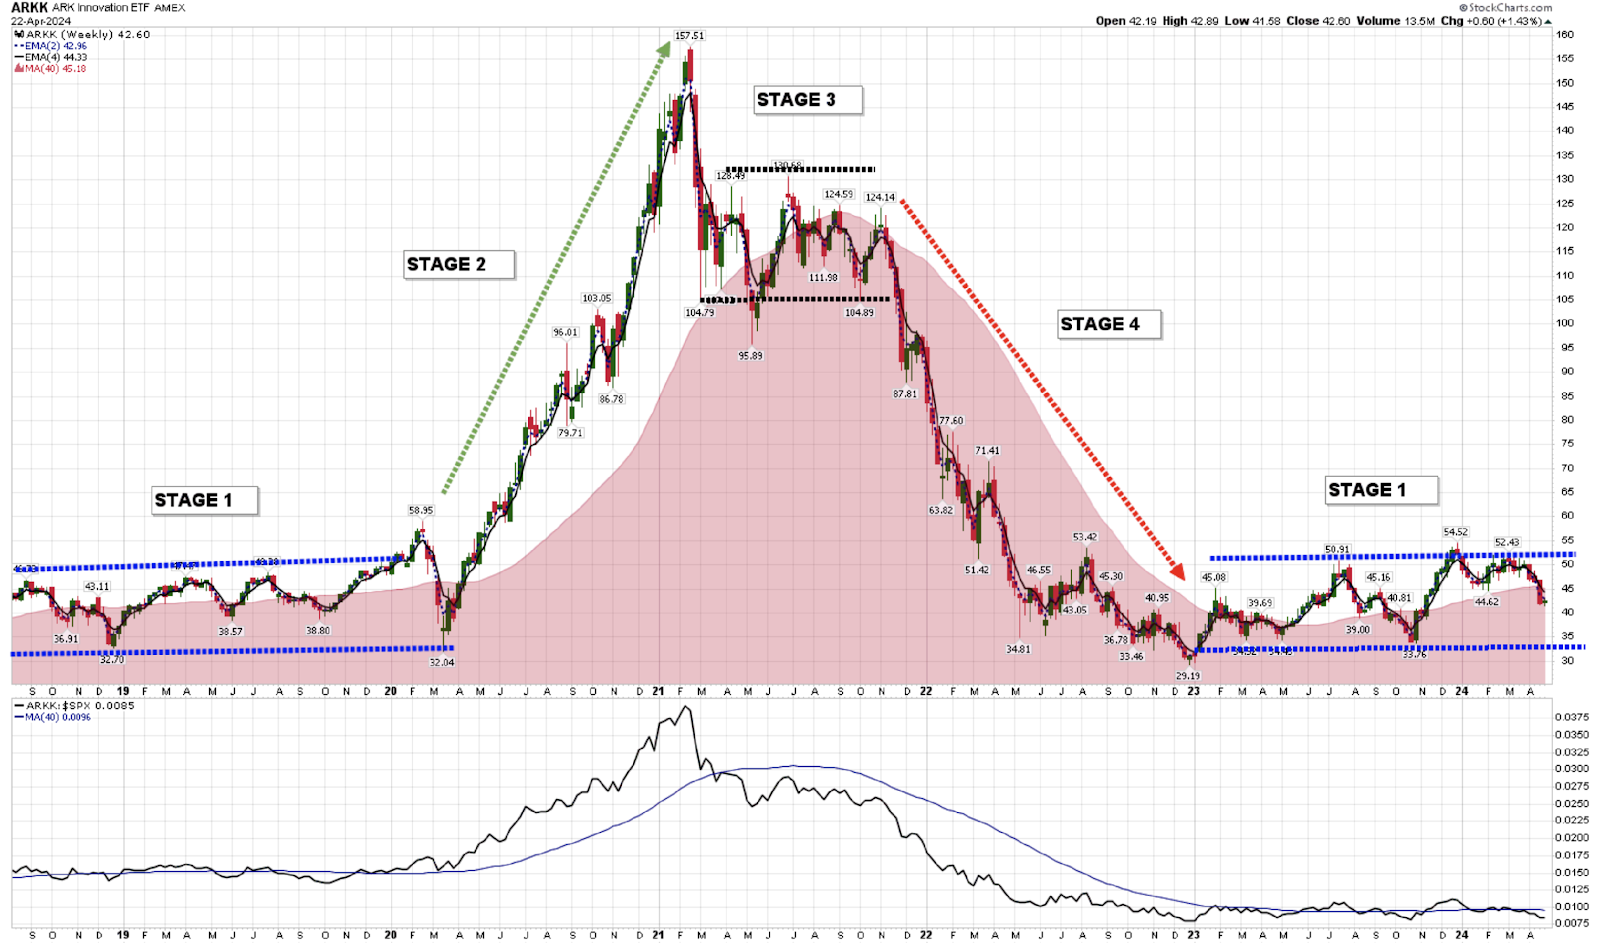
Source: Stockcharts
Whereas “buy and hold” investors just sat through the entire boom and bust and now have nothing to show for their exciting adventure; by utilising stage analysis, an investor or trader would have been able to sell this ETF during Stage 3 and capture the gains.
In case you are wondering, we have not cherry picked this particular ETF to drive home the point that stage analysis works. If you review the weekly charts of numerous stocks (Amazon, Google, Meta, Microsoft, PayPal, Shopify, Square etc) or even the broad stock indices themselves (NASDAQ or S&P500 Index), you will observe that all of them went through the same four stages i.e. accumulation, markup, distribution and markdown.
Some limitations
In the financial markets, no approach is perfect and every system has its limitations. In order to provide you with a balanced view, we have set out the limitations of stage analysis below:-
Whipsaws: Stage analysis is based on trend following, therefore it is susceptible to false price signals which are known as whipsaws. False price signals can lead to incorrect trading decisions and realised financial losses.
Lack of trend: There may be periods when the prices of securities are range-bound i.e. they chop around without a definitive trend and during such periods, stage analysis can produce false breakouts and breakdowns, which result in small realised losses.
Lagging indicator: Stage analysis is based on historical price data and tends to be a lagging indicator. It relies on past price movements to identify trends, which may not always accurately predict future price movements.
Conclusion
Stage analysis offers a systematic approach to market analysis, allowing investors to identify and capitalize on the different stages of a security’s trend. By understanding whether an asset is in an accumulation, markup, distribution, or markdown stage, investors can align their portfolio holdings with the prevalent trend.
It is important to combine stage analysis with fundamental and other technical tools to make well-informed investment decisions. Remember that no approach can guarantee success in the financial markets, but stage analysis provides a valuable framework for market participants to enhance their decision-making processes.
At AlphaTarget, we invest our capital in some of the most promising disruptive businesses at the forefront of secular trends; and utilise stage analysis and other technical tools to continuously monitor our holdings and manage our investment portfolio. AlphaTarget produces cutting-edge research and those who subscribe to our research service gain exclusive access to information such as the holdings in our investment portfolio, our in-depth fundamental and technical analysis of each company, our portfolio management moves and details of our proprietary systematic trend following hedging strategy to reduce portfolio drawdowns. To learn more about our research service, please visit subscriptions.
Portfolio hedging is a risk management strategy employed by investors to protect their investment portfolios from potential adverse market movements. It involves the use of various financial instruments or strategies to offset or mitigate the impact of unfavourable market conditions. The primary objective of portfolio hedging is to reduce the overall risk exposure and minimise potential losses.
The stock market does well over very long-term timeframes (15-20+ years) but it is volatile and secular bear-markets occur which bring about horrendous drawdowns (50%+ at the index level). It is not uncommon for secular bear-markets to last for 10/20/30 years and for the related indices to not make any progress for such extended periods of time! Whilst “buy and hold” works during secular bull-markets, this can be a very challenging and frustrating strategy during secular bear-markets.
Since 1950, there have been over 25 secular bear-markets in stocks in different countries / regions of the world, each lasting for more than 15 years (Figure 1)! It goes without saying, such secular bear-markets test the nerves and patience of even the most enthusiastic investor.
Figure 1: Secular bear-markets are not uncommon
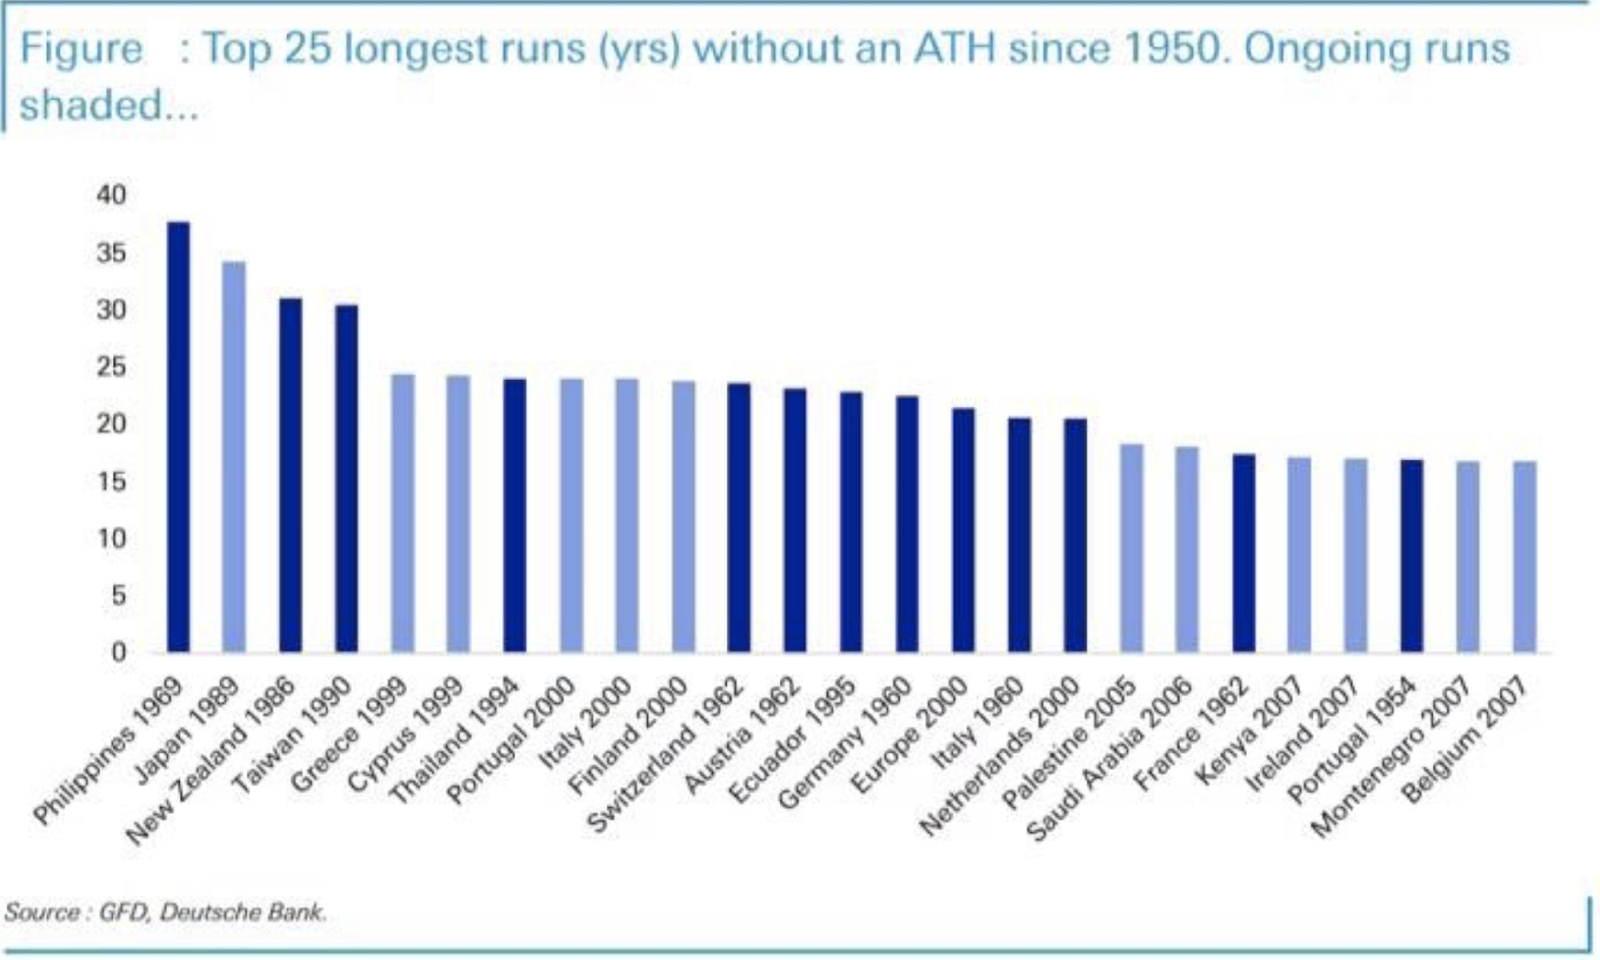
Source: GFD, Deutsche Bank
One way to avoid getting caught in secular bear-markets is by trend-following and cashing out of stocks at the end of primary uptrends and another way is by hedging one’s investment portfolio to offset some of the drawdowns. For our part, we combine both approaches and until we are fully in cash, use a systematic trend following strategy to hedge our long exposure.
In addition to secular bear-markets, hedging also provides protection to an investor’s portfolio from sudden and large stock market declines caused by exogenous shocks, geo-political conflicts, pandemics and recessions.
Portfolio hedging – common approaches
There are several common approaches to portfolio hedging. One popular method is diversification, where investors allocate their capital across different asset classes, sectors, or geographical regions. By spreading investments across a range of assets, an investor hopes that the impact of a downturn in one area can be offset by positive performance in others. In theory, this helps to reduce the correlation and concentration risk within the portfolio. However, under certain market conditions, major asset-classes become highly correlated, and they all decline in tandem!
Another hedging technique is the use of derivatives, such as options or futures contracts. These financial instruments provide investors with the opportunity to protect their portfolio against adverse price movements. For example, investors can purchase put options to establish a predetermined selling price for an asset, thereby limiting potential losses if the asset’s value declines. Similarly, futures contracts can be used to lock in prices for commodities or currencies to hedge against price volatility.
Finally, one can also hedge his/her investment portfolio by shorting ETFs which are correlated to the long holdings in their investment portfolio.
Overall, portfolio hedging is a proactive risk management strategy that helps investors protect their investments from adverse market conditions. It allows them to minimise potential portfolio drawdowns and maintain a more stable and predictable investment performance (equity curve). However, it’s important to note that portfolio hedging strategies come with their own costs and limitations, so investors should carefully consider their objectives, risk tolerance, and always consult with their registered financial adviser before implementing any hedging strategies.
Shorting index ETFs or stock futures is a common strategy used to hedge long exposure in a stock portfolio. When investors short an index ETF or sell stock futures contracts, they aim to profit from a decline in the value of the underlying index or stock. This allows them to offset potential losses in their long positions and create a more market-neutral portfolio, reducing overall risk.
An investor can hedge any type of investment portfolio, but since we allocate our capital to mid to large cap growing businesses, during stock market downtrends, we hedge our exposure by shorting Russell 2000 Index futures. An investor can achieve the same outcome by shorting the related equity index ETF.
By shorting index ETFs, investors can directly hedge their exposure to a specific market index or sector. For example, if an investor holds a portfolio heavily concentrated in technology stocks and wants to hedge against a potential downturn in the technology sector, they can short a technology-focused index ETF. If the technology sector experiences a decline, the short position in the ETF would generate profits that offset the losses in the long positions.
Alternatively, (like us) investors can utilise stock futures contracts to establish a hedge. By selling stock futures contracts, investors commit to selling a specified number of contracts at a predetermined price in the future. If the stock market declines, the value of the futures contracts decreases, thereby generating profits and offsetting losses in the long portfolio.
When implementing a hedge, investors have the option to hedge on a 1:1 basis, where the value of the hedge matches the value of the long position. This provides a direct offset to the portfolio’s risk. Alternatively, investors can choose to beta-hedge, which involves adjusting the size of the hedge based on the beta or correlation of the portfolio to the market index. This approach aims to provide a more effective hedge by considering the portfolio’s specific volatility characteristics.
During the duration of the hedge, the portfolio becomes less risky and more market neutral. The short positions in the index ETFs or stock futures help to balance out potential losses in the long positions, reducing the portfolio’s overall exposure to market fluctuations.
It’s important to note that while shorting index ETFs or stock futures can be an effective hedging strategy, it also carries risks. Instead of declining, if the stock market rallies, the short positions produce losses, but these are offset by the long positions in an investor’s stock portfolio. Additionally, costs such as borrowing fees or margin requirements should be considered.
Systematic trend following hedging
To short index ETFs or stock futures, like us, investors can employ a systematic trend following strategy to determine when to initiate and remove the hedge. By using this approach, the decision-making process becomes rule-based, relying on objective criteria rather than subjective discretion or emotions.
A systematic trend-following strategy involves analysing market trends and using predefined rules to determine whether to implement or remove a hedge. Typically, momentum and/or volatility indicators are utilised to identify stock market downtrends or uptrends.
When the trend following indicators signal the start of a new downtrend, the investor would initiate the hedge by shorting stock index futures or ETFs. This helps protect the portfolio from potential losses during the downward market move.
Conversely, when the trend following indicators indicate the end of the downtrend and the start of an uptrend, the systematic strategy triggers the removal of the hedge. At this point, the investor would close the short positions in the index futures or ETFs, allowing the portfolio to benefit from the subsequent upside in the market.
The use of a systematic trend following strategy adds an objective and disciplined approach to the hedging process. It removes the element of emotion and subjective judgment from the decision-making, relying solely on predetermined rules and technical indicators to determine when to hedge and when to remove the hedge.
By employing this systematic approach, investors can potentially benefit from market trends while reducing the overall risk and volatility of their portfolio. However, it’s important to note that no strategy is foolproof, and investors should carefully evaluate the effectiveness of trend following indicators and consider potential risks and costs associated with implementing this strategy.
Our extensive back testing has revealed that since the start of the new millennium, our proprietary systematic trend following hedging strategy would have marginally reduced long-term returns but significantly reduced one’s portfolio drawdowns during all severe stock market downtrends.
Figure 2 shows the signals generated by our proprietary systematic trend following hedging strategy during the COVID-crash in early 2020 as well as during the 2022 stock bear-market.
As you can see, our proprietary systematic hedging strategy gave us the signal to hedge our portfolio just before the COVID-crash and it told us to remove the hedge just after the crash. Conversely, no hedging signal was generated during the strong stock market uptrend between spring 2020 and summer 2021. There was one false signal (whipsaw) in autumn 2021 but our hedging system correctly got us hedged in late 2021 and the signal to remove that hedge only came in August 2022.
Figure 2: Our proprietary systematic hedging strategy on display
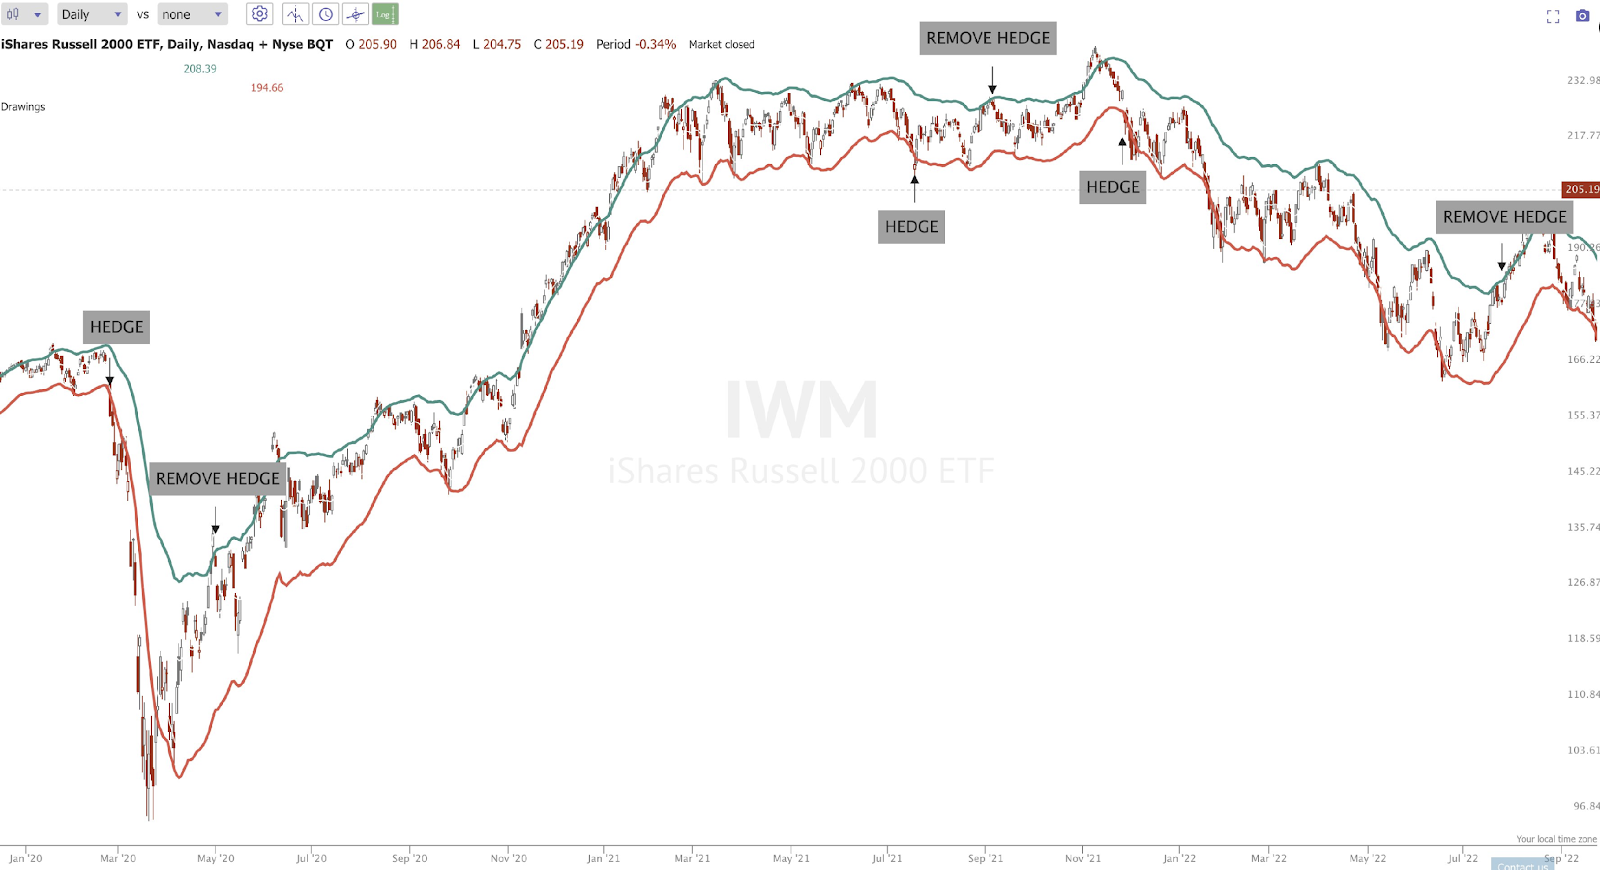
Source: Trendspider
As you can see from the above, during the recent two bear-markets, our proprietary systematic hedging strategy generated accurate signals to protect our capital and mitigate our portfolio drawdown.
At AlphaTarget, we invest our capital in some of the most promising disruptive businesses at the forefront of secular trends; and utilise stage analysis and other technical tools to continuously monitor our holdings and manage our investment portfolio. AlphaTarget produces cutting-edge research and those who subscribe to our research service gain exclusive access to information such as the holdings in our investment portfolio, our in-depth fundamental and technical analysis of each company, our portfolio management moves and details of our proprietary systematic trend following hedging strategy to reduce portfolio drawdowns. To learn more about our research service, please visit subscriptions.
A vast array of investment options are available to investors, yet there can be no doubt that stocks are the best asset-class for long-term wealth creation. Whilst it is true that other asset-classes have their merits, history has shown that over the past century, stocks have significantly outperformed cash, corporate bonds, government bonds and gold.
Stocks represent part ownership stakes in real-world businesses (productive assets) and over the past century, thousands of world-changing businesses have invented invaluable products and/or services which have changed the way humans work, live and play. By enriching their customers’ lives, these businesses have not only benefited humanity, they have also created immense wealth for their owners or shareholders.
As businesses keep capturing new markets, introducing new innovative products and services, they will continue to generate ever increasing revenues, profits and free cash flows which will in turn make them more valuable over time.
As you can see from Figure 1, over the past 200+ years, US stocks have significantly outperformed other major asset-classes and given the pace of ongoing innovation, expansion of the middle-class in the developing world and population growth, American businesses are likely to continue to prosper over the long-term.
Figure 1: US stocks’ outperformance is staggering!
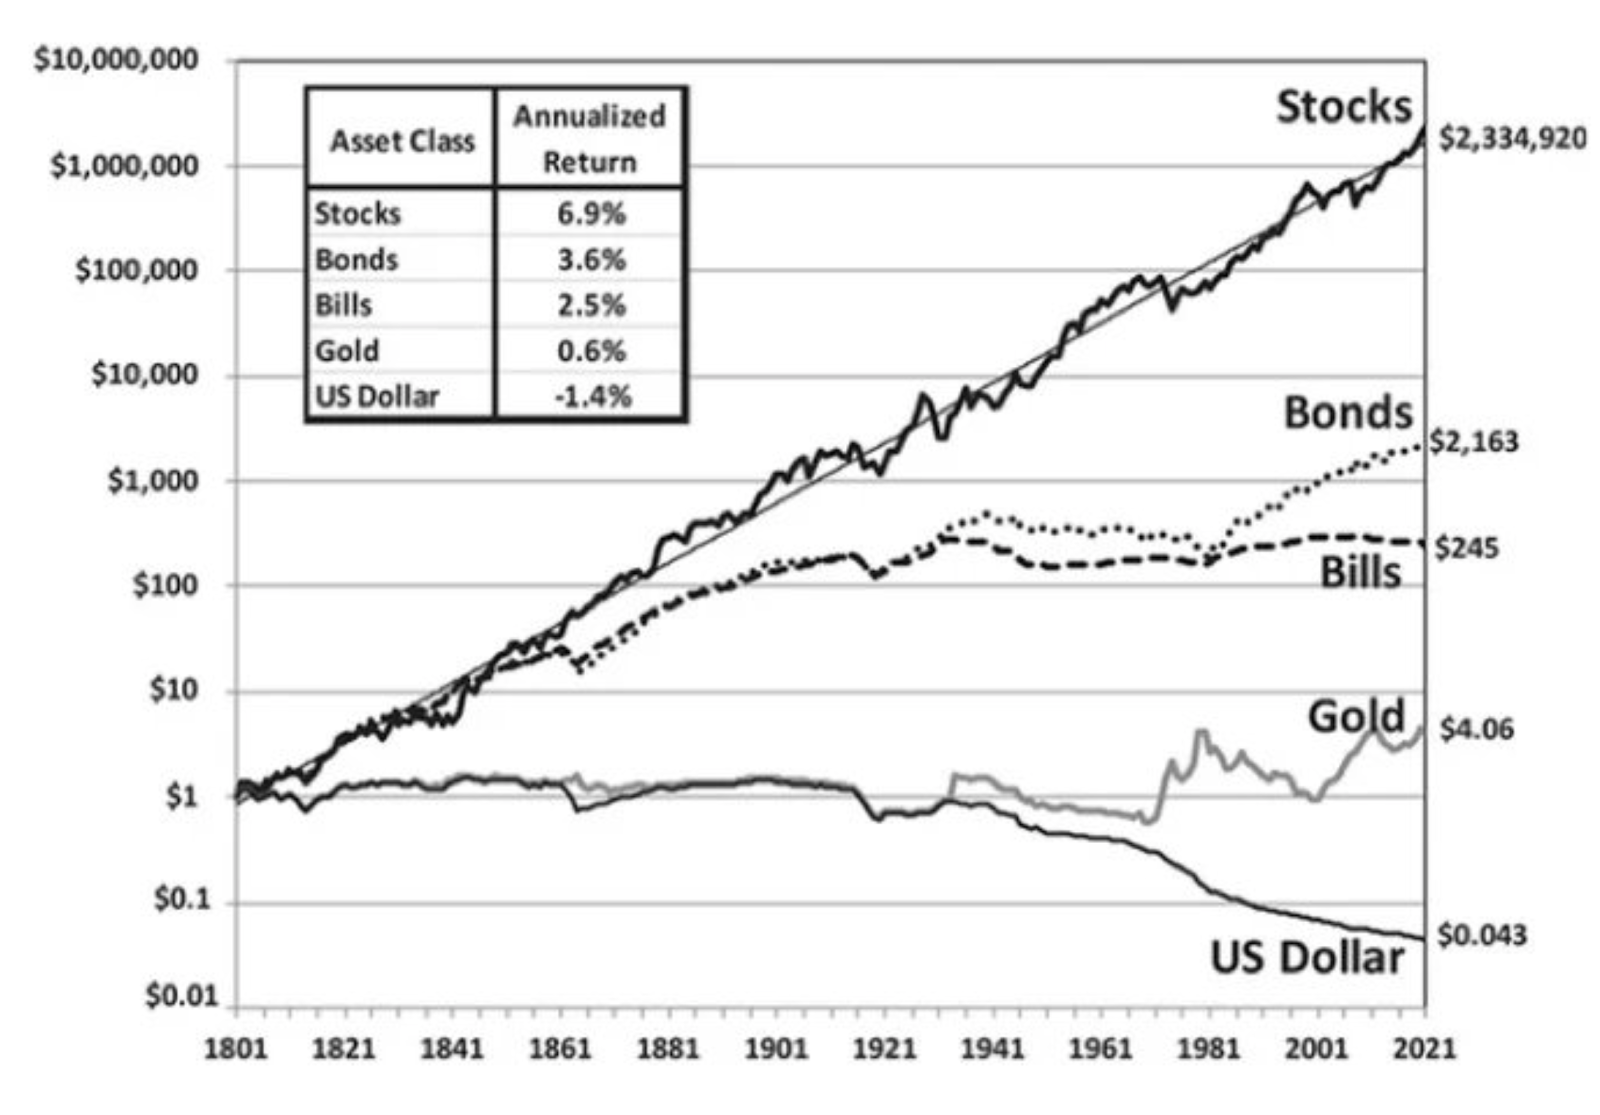
Source: Stocks for the long run, Jeremy Siegel
Although US stocks have done well at an index-level, many dominant and disruptive businesses have done exceedingly well and compounded their revenues, profits and free cash flows at very high rates for very long periods of time! Consequently, the market capitalisations of such enterprises have grown at unbelievable rates; and handsomely rewarded their shareholders.
Before the advent of the internet, several businesses such as Adidas, American Express, Burger King, Coca-Cola, Colgate, Domino’s Pizza, IBM, KFC, Levi’s Strauss, McDonald’s, Mastercard, Nike, Philip Morris, Procter & Gamble, Unilever and Visa became household names and took over the world.
In the internet era, many disruptive businesses such as Airbnb, Amazon, Apple, Expedia, Facebook (now Meta), Priceline (now Booking.com), Google (now Alphabet), Netflix, Nvidia, Spotify, Tesla and Uber have captured the hearts and minds of billions of people.
Although the above businesses operate in different fields, they demonstrate the power of human ingenuity; and prove that if the sharpest minds in the world get together and there is no dearth of capital, the outcomes can be truly spectacular!
Since the start of the new millennium, many dominant businesses in enterprise software, online advertising, online gaming, online retail, online travel, payments, music and video streaming have done very well.
Turning to investment performance, although US stocks at the index-level (S&P 500 Index) have compounded at 10% per annum over several decades, the market capitalisations of the disruptive, dominant, rapidly growing businesses have compounded at very high rates (15/20/30% per annum)!
The bottom-line is that although investing in stocks via index investing is a lucrative endeavour over the long run, investing in disruptive, rapidly growing businesses with unique advantages has the potential to produce truly life changing returns.
At AlphaTarget, our team conducts in-depth research and invests its own capital in such disruptive businesses which are characterised by recurring revenues or frequent/repeat purchases by their customers, high gross margins, free cash flows and strong returns on invested capital (ROIC) at maturity.
Rationale for investing in disruptive companies
Innovation
Investing in disruptive businesses allows one to tap into the transformative power of innovation. Such companies challenge traditional norms, introduce ground-breaking products and services, or technologies that revolutionise entire industries. By identifying and investing in disruptive businesses early on, we seek to participate in the significant growth opportunities as these companies reshape markets and capture existing demand from competitors.
Rapid growth
Rapidly growing businesses possess the capacity to generate substantial returns over the long term. Disruptive companies either operate in nascent industries or have unique business models that enable them to expand quickly. By investing in such companies, investors can position themselves to ride the wave of growth and benefit from the compounding effect that can significantly enhance their investment returns over time.
High margins and scalability
At AlphaTarget, we primarily focus on the disruptive, online businesses because these enterprises tend to have high gross margins and also high net profit margins at scale. When it comes to the online economy, the cost of producing digital services is usually low (operating expenses are much lower than brick-and-mortar businesses).
Once they have established their infrastructure and systems, online businesses can serve a large number of customers without significant incremental costs. This allows them to generate higher revenue without a proportional increase in costs, resulting in higher margins.
Online businesses can often scale their operations more efficiently than traditional offline businesses. Digital products and services can be replicated and distributed at minimal or zero marginal cost, allowing online companies to reach a broader audience without incurring substantial expenses for each additional customer.
Free cash flows and high ROIC
Disruptive companies often have high free cash flow margins and return on invested capital (ROIC) due to their innovative business models. They operate with streamlined processes, lower costs, and efficient supply chains, allowing them to generate significant cash flows. In the online world, the nature of the offerings of the dominant businesses enables rapid cash flow generation without proportionate increases in capital spending, resulting in high free cash flows and high ROIC.
Outperforming index investing
Investing in innovative businesses provides the potential to outperform index investing. These companies are able to rapidly grow their business for long periods of time, which enables them to outpace broader market indices over the long-term. By carefully evaluating and selecting disruptive businesses, investors can seek to outperform passive index strategies and potentially achieve superior returns.
Investing with the secular trends
Disruptive businesses usually operate at the forefront of new industries. At AlphaTarget, we observe the secular trends in the business world, study the dominant businesses and invest our capital in the most promising companies.
Over the past two decades, the below secular trends have transformed the business world:
E-commerce
E-commerce has witnessed extraordinary growth, transforming the retail landscape and creating immense investment opportunities. Companies like Amazon, Alibaba, Mercadolibre and Shopify have demonstrated unprecedented growth, reshaping consumer behaviour and capturing significant wealth for shareholders.
Dominant online travel agencies such as Expedia and Priceline (now Booking.com) have totally disrupted the industry, upended millions of traditional online agents and created immense value for their shareholders.
E-commerce penetration is still fairly low in many parts of the world, so the leading
businesses in this space are likely to continue to do well over the next few years.
Online payments
The rapid proliferation of online payments has revolutionised the financial industry, offering convenience, security, and efficiency. Companies like Adyen, PayPal, Mercadolibre, Square and Stripe have thrived in this space, providing seamless payment solutions that enable individuals and businesses to transact online. As digital payments become increasingly ubiquitous, investing in the leading online payment providers allows investors the opportunity to capitalise on the growth of cashless transactions and the expanding e-commerce ecosystem.
Music and video streaming
The advent of streaming services has disrupted traditional media consumption patterns, providing consumers with on-demand access to a vast array of content. Companies like Netflix and Spotify have emerged as pioneers in this space, experiencing exponential growth and reshaping the entertainment industry. Investing in the streaming sector has allowed investors to tap into the evolving consumer preferences and the shift towards digital content consumption.
Enterprise software
Enterprise software solutions have become integral to modern businesses, driving efficiency, productivity, and digital transformation. Due to cloud computing and “Software as a Service” (SaaS), enterprise software vendors now have sticky recurring revenues and they have become modern-day utilities.
The public hyperscalers have also spawned a new generation of software businesses which have experienced remarkable growth by providing cloud-based infrastructure services. Investing in leading enterprise software providers has offered investors exposure to the ongoing digitisation of businesses and the growth runway appears to be long.
Looking ahead
Long-term projections of any kind should be made with humility but at AlphaTarget, we have high conviction that the e-commerce, fintech/online payments, music/video streaming and software industries will continue to grow. Additionally, we believe that nascent industries such as autonomous driving, gene editing, robotics and space exploration will also transform the way humans live, work and play.
If our world-view is correct, the biggest transformation will be in Artificial Intelligence (AI). According to our research, AI is a major technological revolution and over the next decade, it will transform every industry.
Investing in AI-focused businesses will allow investors to participate in the next wave of technological advancements and potentially benefit from the transformative power of AI across various sectors, including education, finance, healthcare, professional services, robotics, transportation, and more.
Since the launch of ChatGPT (autumn 2022), due to the AI infrastructure (datacentres) build up, dominant “picks and shovels” plays in AI such as NVIDIA and Super Micro Computer have already made a small fortune and rewarded their shareholders.
Going forward, as businesses begin to monetise AI, we expect some companies at the application layer to prosper. Additionally, enterprise software companies which successfully deploy AI agents on top of their software platforms should also reward their shareholders.
At AlphaTarget, we invest our capital in some of the most promising disruptive businesses at the forefront of secular trends; and utilise stage analysis and other technical tools to continuously monitor our holdings and manage our investment portfolio. AlphaTarget produces cutting-edge research and those who subscribe to our research service gain exclusive access to information such as the holdings in our investment portfolio, our in-depth fundamental and technical analysis of each company, our portfolio management moves and details of our proprietary systematic trend following hedging strategy to reduce portfolio drawdowns. To learn more about our research service, please visit subscriptions.