Successful investing often requires a disciplined and systematic approach to analysing financial markets. One such approach that has gained popularity among traders and investors is “Stage Analysis”. Stage analysis was developed by Stan Weinstein, an American stock market technician and trader. In 1988, he introduced this approach in his book titled “Secrets for Profiting in Bull and Bear Markets”. In his book, Stan Weinstein outlined his methodology for identifying the primary trend and offered practical guidance for applying stage analysis in managing stock positions.
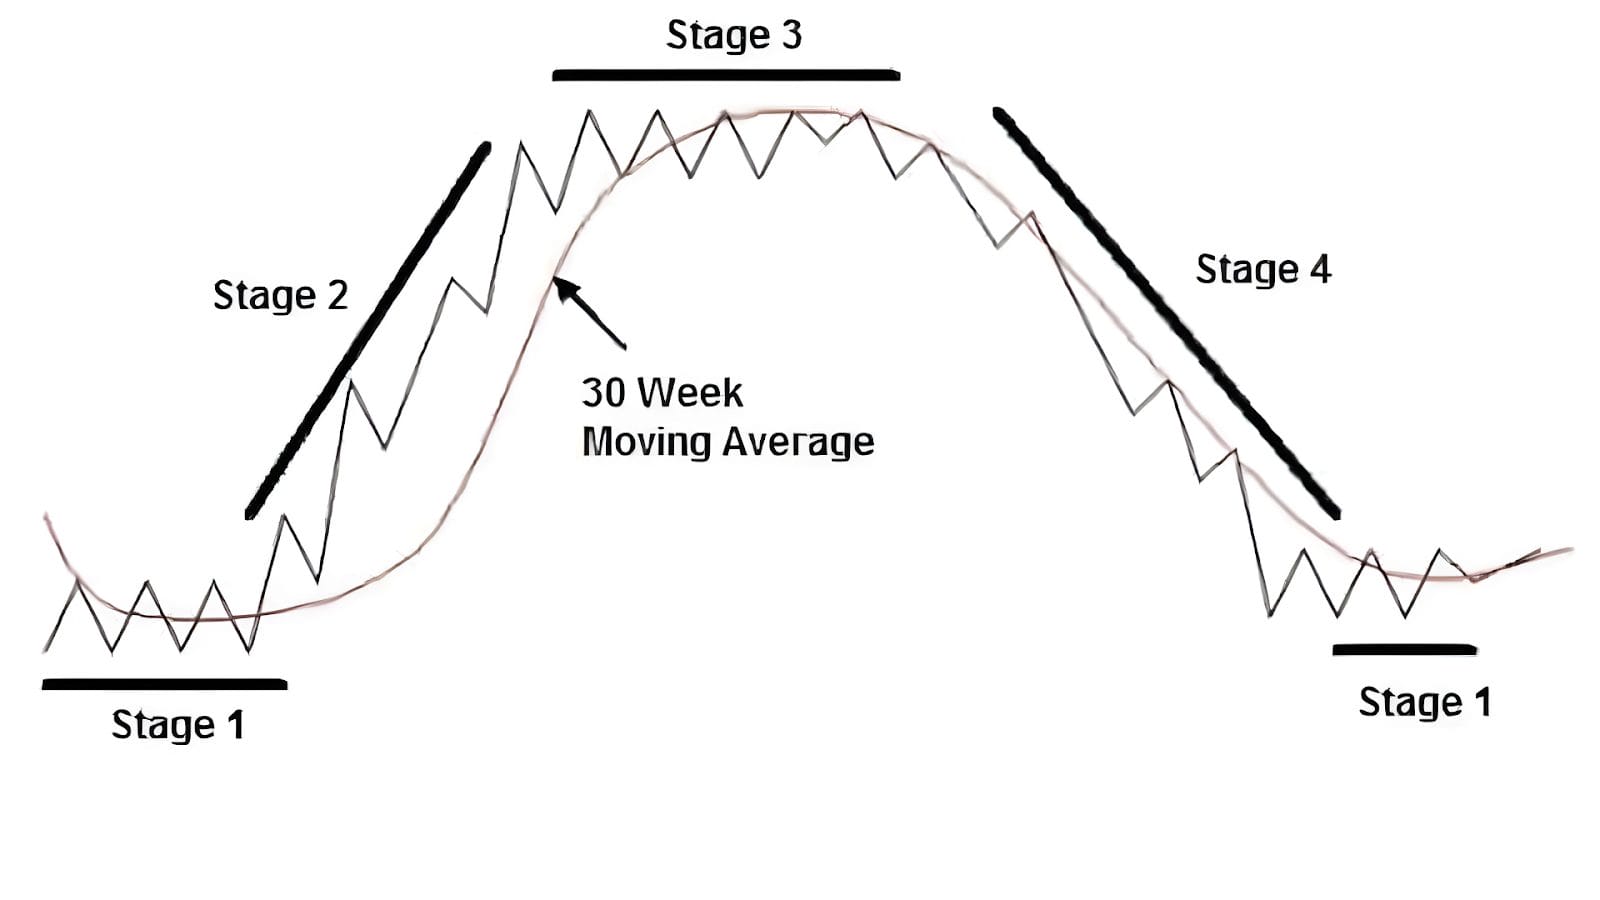
Stage analysis is based on trend following and it is a comprehensive framework that seeks to identify and capitalise on different stages of a security’s trend (Figure 1). By applying a primary trend filter (long-term moving average) and understanding the market's stage, investors can make more informed decisions, reduce their portfolio drawdowns and potentially enhance their investment returns.
Originally, Stan Weinstein used the 30-week moving average as his primary trend filter but he has now switched to the 40-week moving average (200-day moving average). At AlphaTarget, we use the 40-week moving average as the primary trend filter for identifying any stock’s or stock market’s major trend.
Figure 1: Visual example of Stage Analysis

Source: Secrets of Profiting in Bull and Bear Markets, Stan Weinstein
In this article, we outline the key principles of stage analysis and how it can be applied in practice to profitably invest and trade in stocks.
Understanding Stage Analysis
Stage analysis is based on the premise that stocks and stock indices go through distinct stages of accumulation (Stage 1), markup (Stage 2), distribution (Stage 3), and markdown (Stage 4). These stages are driven by supply and demand; and more importantly by the actions of institutional investors, who have a significant influence on market trends. By identifying which stage a stock or a stock index is in, investors can align their portfolio holdings with the market and swim with the tide.
The underlying principle of stage analysis (a form of trend following) is that an investor or trader ought to buy stocks during the accumulation stage, hold stocks during the markup stage, sell stocks during the distribution stage and stay out of harm’s way during the markdown stage.
Instead of “buying and holding” stocks for the long-term, riding out the periodic downtrends and enduring large portfolio drawdowns, practitioners of stage analysis sell their holdings during the distribution phase (before the onset of large declines during the markdown stage).
A brief description of each stage is provided below:-
Accumulation Stage: The accumulation stage known as “Stage 1” is when a stock or stock index builds a trading range or “base” and this represents a period when smart money slowly accumulates positions in a security. During this stage, the 40-week moving average is flat, there is no clear trend and prices tend to be range-bound, as institutional investors quietly build their positions. Volume is usually low during this stage, and the stock or stock index exhibits a lack of clear direction. The accumulation stage can last for several weeks or even months. At AlphaTarget, we usually build positions in stocks during this stage.
Markup Stage: The markup stage known as “Stage 2” is characterised by a sustained uptrend or markup in prices. During this stage, the 40-week moving average turns up (starts sloping upwards), institutional investors actively buy the security, driving prices higher. Volume typically expands during this stage as more market participants join the trend and the price of the security tends to stay above the 40-week moving average. Breakouts from consolidation patterns and strong upward momentum are common features of the markup stage. This is the stage when the big money is made. During this stage, when the prices of securities run up too far away from their rising 40-week moving average, partial profits are booked and when prices pull back towards the 40-week moving average, cash is re-deployed.
Distribution Stage: The distribution stage known as “Stage 3” occurs when institutional investors start selling their positions. After a steady rise during the markup stage “Stage 2”, prices stop rising and they enter a consolidation phase. Volatility picks up during this stage and every rally attempt is met with renewed selling and this “tug of war” between buyers and sellers causes prices to zig and zag. Volume often remains high as institutions distribute their holdings to retail investors. During this stage, the 40-week moving average stops rising and eventually rolls over. Distribution can last for a considerable period, and it can sometimes be challenging to identify the end of this stage.
Markdown Stage: The markdown stage known as “Stage 4” represents a prolonged decline in prices; therefore, big losses build up during this stage. In this stage, institutional investors have largely exited their positions, and supply overwhelms demand. Prices exhibit a downtrend, characterized by lower lows and lower highs. Volume may initially decline during this stage, and selling pressure dominates the market sentiment. During the markdown stage, the 40-week moving average is declining (sloping downwards) and prices tend to stay below this key technical level. Towards the end of Stage 4, volume often picks up during a selling climax when novice investors throw in the towel and institutions start snapping up bargains. Practitioners of stage analysis, do not hold falling securities during this stage and they stay out of harm’s way.
Applying Stage Analysis in Practice
Stage analysis can be applied to various financial markets, including stocks, commodities, and cryptocurrencies. Here are some key steps to keep in mind when utilising stage analysis:-
Chart Analysis: Start by analysing price charts of the asset you are interested in. Look for evidence of accumulation, markup, distribution, or markdown stages. Identify key support and resistance levels, and chart patterns to assist in determining the market stage.
Volume Analysis: Examine volume patterns during different stages. Volume can provide insights into institutional activity and the strength of market trends. Higher volume during markup stages and lower volume during distribution and markdown stages can be indicative of market behaviour.
Relative strength: When applying stage analysis on stocks, gauge a security’s relative strength versus the S&P500 Index to determine if it is stronger or weaker than the broad market. Focus on securities which are showing relative strength.
Risk Management: Implement proper risk management strategies to protect capital. Set stop-loss orders and define risk-reward ratios based on the identified stage. Adjust position sizes and trailing stops as the market progresses through different stages. Never own a security during the markdown stage (Stage 4) when prices are trending lower beneath the declining long-term moving average.
Real-world example
Financial markets are driven by human emotion and when investors are optimistic and confident about the future prospects, they engage in buying activity, driving prices higher and creating an upward trend. This positive sentiment can become contagious, attracting even more buyers and further fuelling the trend.
Conversely, when fear or pessimism dominates the market sentiment, investors engage in selling activity, causing prices to decline and creating a downward trend. Negative news, economic uncertainty, or geopolitical tensions can trigger such emotions and lead to a cascade of selling pressure.
As long as emotional human beings are involved in the financial markets, assets and securities will continue to trend in both directions and this will allow trend followers and practitioners of stage analysis to exploit these exaggerated price swings.
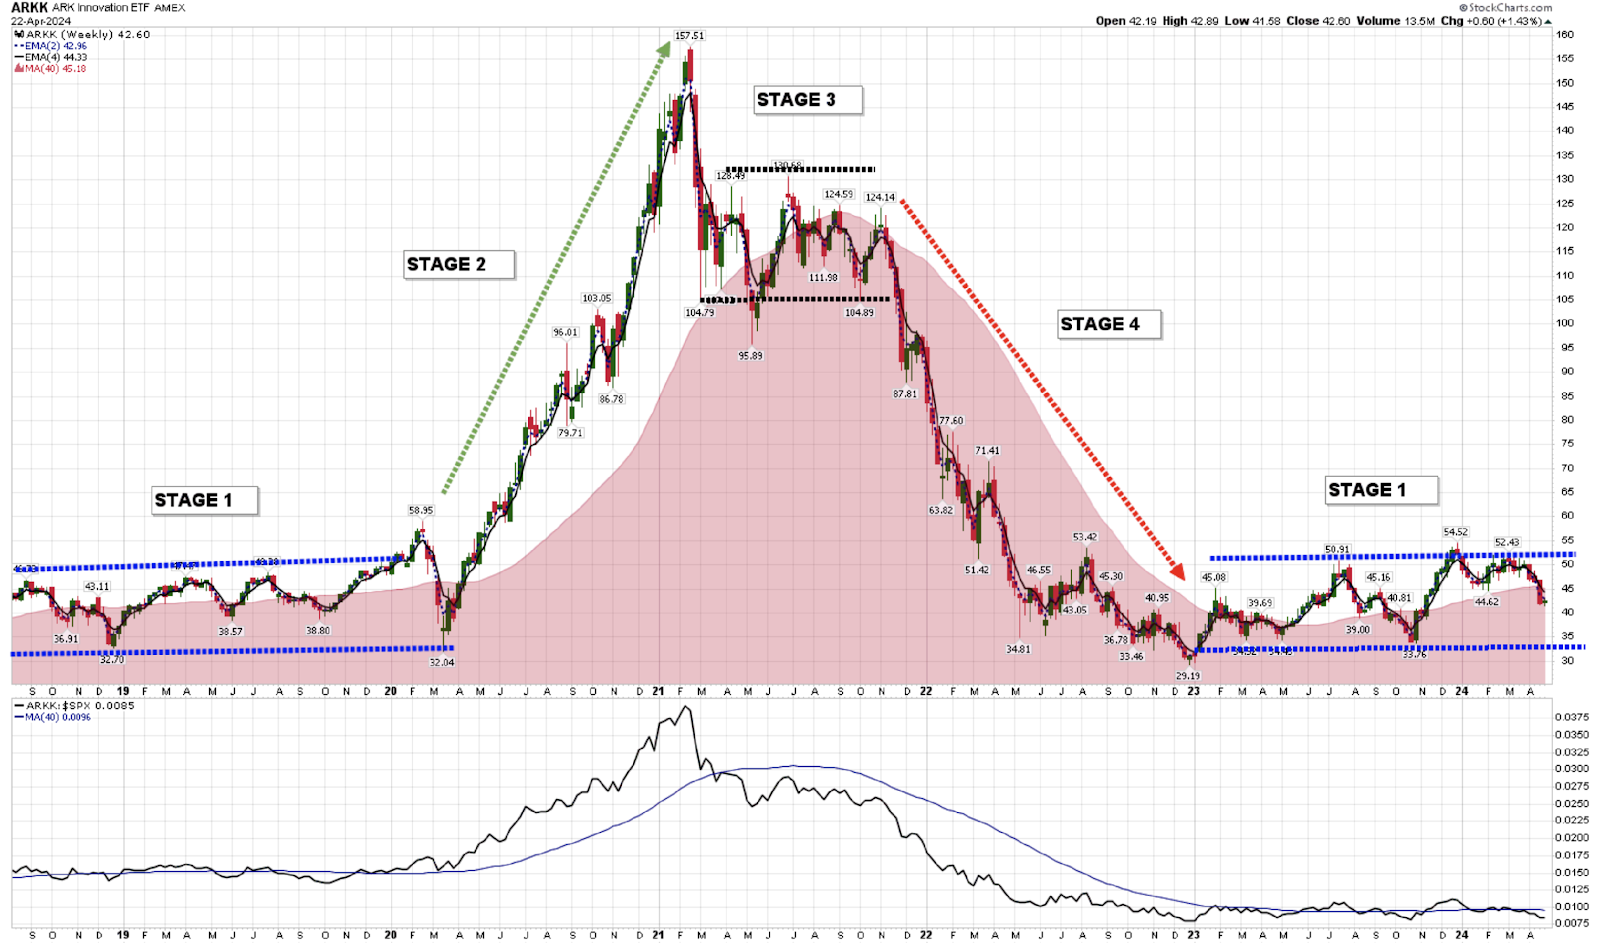
In order to show that stage analysis still works in the real-world, we want you to review the boom and bust phenomenon of ARK Innovation ETF (Figure 2). Admittedly, this is an extreme example of a severe boom and bust cycle caused by the Federal Reserve’s extreme policies. Nonetheless, this chart beautifully demonstrates how utilisation of stage analysis would have enabled an investor or trader to capture gains and leave the party before everything turned into pumpkin and mice.
During 2020, in response to the unprecedented monetary easing by the Federal Reserve, the ARK Innovation ETF (ARKK) broke out into its markup stage (Stage 2) and its price increased by ~400% within a year! Thereafter, when inflation rose and the Federal Reserve pursued tight monetary policies, ARKK peaked in a classic distribution stage (Stage 3) and eventually, it gave back all of its prior gains during its markdown stage (Stage 4)! Note how the 40-week moving average (red shaded area on the chart) remained flat during Stage 1, rose during Stage 2, peaked/rolled over during Stage 3 and sloped downwards during Stage 4.
The black line in the bottom panel shows how ARKK exhibited relative strength versus the S&P500 Index during Stage 2 and relative weakness during Stage 3 and 4.
Figure 2: Real-world example of stage analysis

Source: Stockcharts
Whereas “buy and hold” investors just sat through the entire boom and bust and now have nothing to show for their exciting adventure; by utilising stage analysis, an investor or trader would have been able to sell this ETF during Stage 3 and capture the gains.
In case you are wondering, we have not cherry picked this particular ETF to drive home the point that stage analysis works. If you review the weekly charts of numerous stocks (Amazon, Google, Meta, Microsoft, PayPal, Shopify, Square etc) or even the broad stock indices themselves (NASDAQ or S&P500 Index), you will observe that all of them went through the same four stages i.e. accumulation, markup, distribution and markdown.
Some limitations
In the financial markets, no approach is perfect and every system has its limitations. In order to provide you with a balanced view, we have set out the limitations of stage analysis below:-
Whipsaws: Stage analysis is based on trend following, therefore it is susceptible to false price signals which are known as whipsaws. False price signals can lead to incorrect trading decisions and realised financial losses.
Lack of trend: There may be periods when the prices of securities are range-bound i.e. they chop around without a definitive trend and during such periods, stage analysis can produce false breakouts and breakdowns, which result in small realised losses.
Lagging indicator: Stage analysis is based on historical price data and tends to be a lagging indicator. It relies on past price movements to identify trends, which may not always accurately predict future price movements.
Conclusion
Stage analysis offers a systematic approach to market analysis, allowing investors to identify and capitalize on the different stages of a security’s trend. By understanding whether an asset is in an accumulation, markup, distribution, or markdown stage, investors can align their portfolio holdings with the prevalent trend.
It is important to combine stage analysis with fundamental and other technical tools to make well-informed investment decisions. Remember that no approach can guarantee success in the financial markets, but stage analysis provides a valuable framework for market participants to enhance their decision-making processes.
At AlphaTarget, we invest our capital in some of the most promising disruptive businesses at the forefront of secular trends; and utilise stage analysis and other technical tools to continuously monitor our holdings and manage our investment portfolio. AlphaTarget produces cutting-edge research and those who subscribe to our research service gain exclusive access to information such as the holdings in our investment portfolio, our in-depth fundamental and technical analysis of each company, our portfolio management moves and details of our proprietary systematic trend following hedging strategy to reduce portfolio drawdowns. To learn more about our research service, please visit subscriptions.


